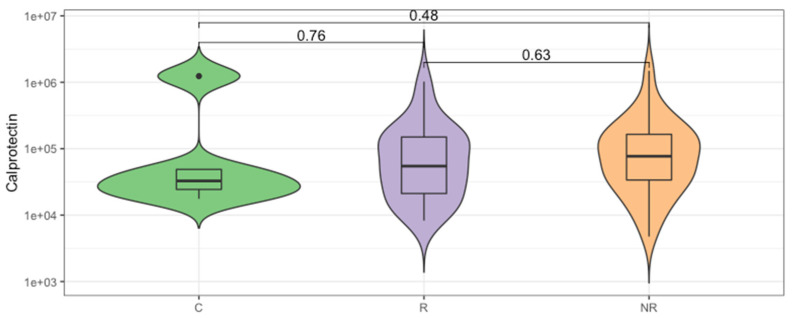
Figure 3.
The inflammatory state of gut mucosa was evaluated by calprotectin concentration measurement in the stool of study participants. Comparison between groups of controls (C) and the anti-PD-1 recipients before the first injection of the ICI therapeutics, classified as responders (R) and non-responders (NR) according to the clinical outcome of ICI therapy. The p-values describing the statistical significance of the calprotectin level in the study groups were calculated with Wilcoxon Rank Sum Test. The plot is in a logarithmic scale.

