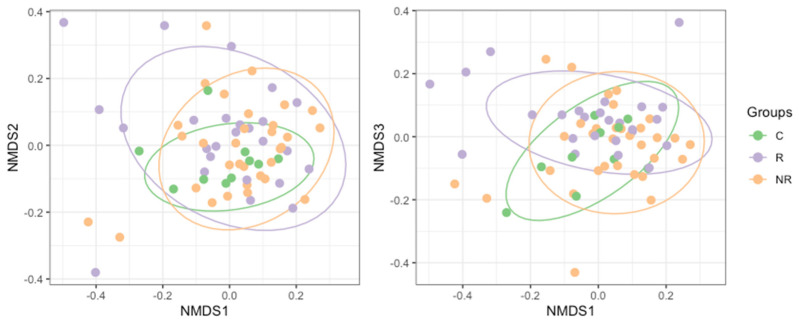
Figure 5.
NMDS (non-metric multidimensional scaling) plot based on Bray–Curtis dissimilarity of the bacterial microbiota composition in study groups (R—responders, NR—non-responders, and C—controls). Permutation multivariate analysis of variance revealed significant differences between the groups (R2 = 0.0491 and p = 0.0089).

