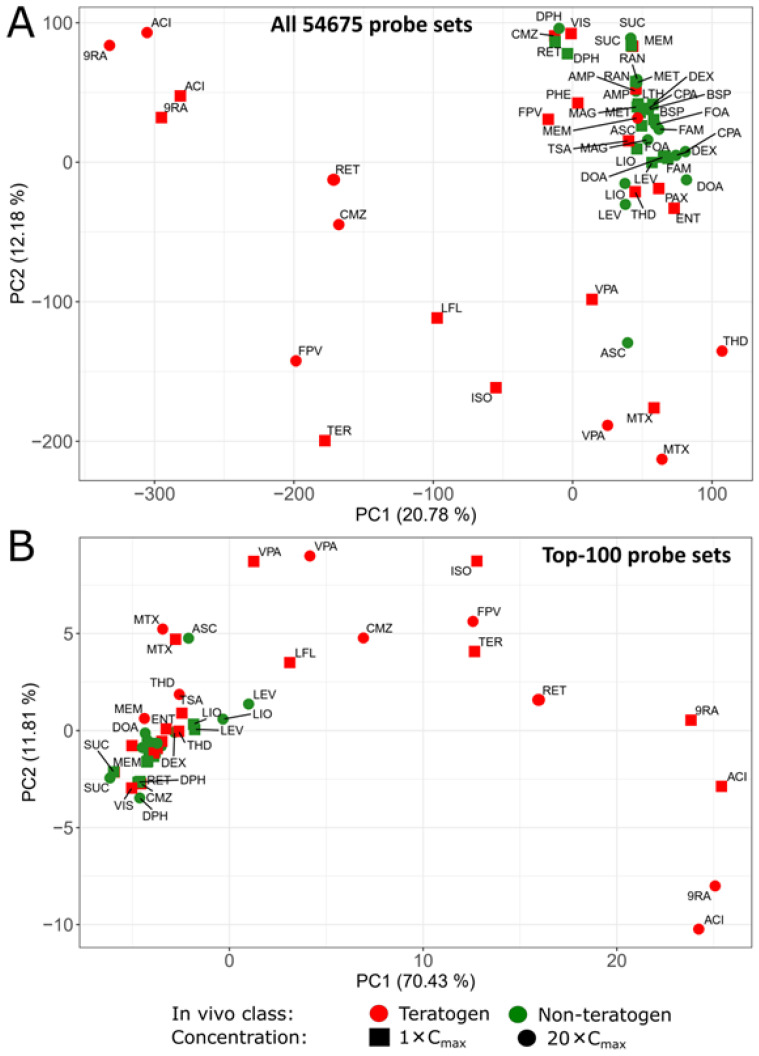
Figure 2.
Principal component analysis (PCA) of the teratogenic and non-teratogenic compounds in the UKN1 test. Two PCA-Plots are presented of (A) all 54,675 probe sets and (B) the 100 probe sets with the highest variance across the mean of the condition-wise samples. Green and red tags represent in vivo non-teratogens and teratogens, respectively. 1-fold Cmax and 20-fold Cmax concentrations are indicated by squares and circles, respectively. The distribution of the data points on the x-axis is given by the principal component (PC) 1 and on the y-axis by PC2. The percentages in parentheses denote the proportion of explained variance for the respective PC. Compound abbreviations are explained in Table 1.

