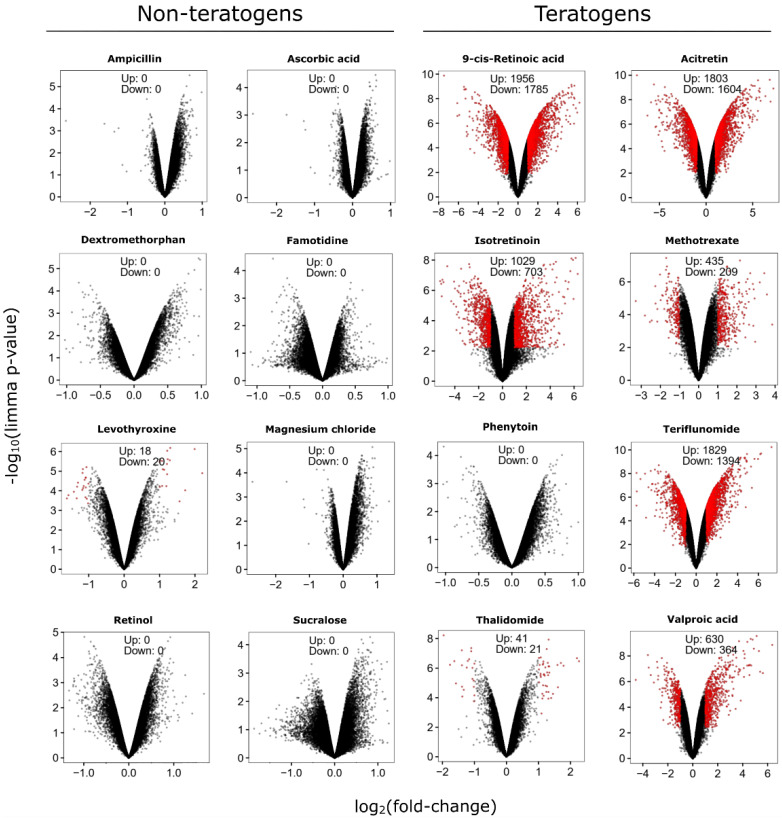
Figure 3.
Volcano plots of deregulated probe sets of selected test compounds in the UKN1 test. Volcano plots show genome-wide gene expression changes in substance-exposed SBAD2 cells for a representative subset of known teratogens and non-teratogens at therapeutic 1-fold Cmax concentrations. Each dot represents one out of 54,675 probe sets from the Affymetrix gene chips. The fold-change of the differentially-expressed probe sets in substance-exposed cells is given on the x-axis in log2-values, and the corresponding p-values of the limma-analyses are given on the y-axis in negative log10-values. Red dots represent probe sets with a statistically significant, FDR-adjusted p-value < 0.05 and an absolute fold-change > 2. The numbers of up- and downregulated red-dot-probe sets are indicated.

