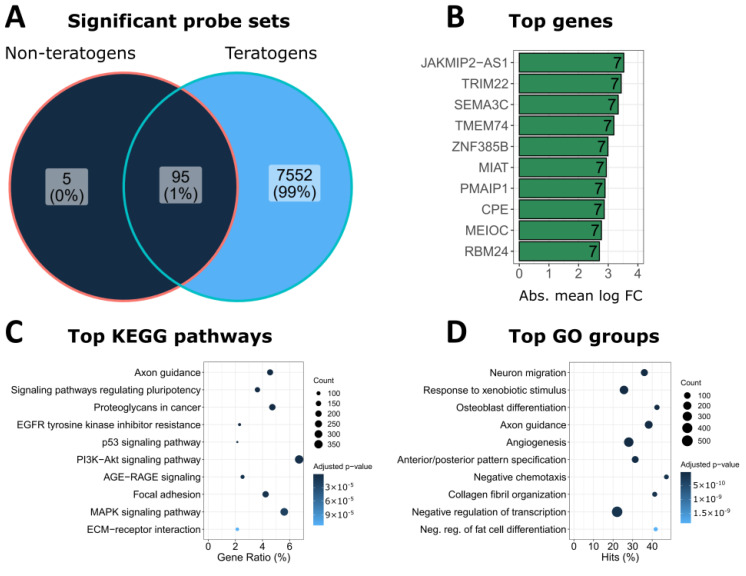
Figure 5.
Biological interpretation of genes differentially expressed after exposure of hiPSC to teratogens at 20-fold Cmax. (A) Number of significant probe sets (log2 fold change > 1; adjusted p-value < 0.05) induced by non-teratogens and teratogens at the 20-fold Cmax (including also 10-fold Cmax carbamazepine and 1.67-fold Cmax VPA). (B) Top-10 genes from the 7647 SPS deregulated by teratogens. The number in the bar indicates the number of compounds that deregulated the specific gene. The absolute mean log2 fold-change of each gene is given on the x-axis. A comprehensive gene list is given in the Supplementary Excel-file 1. (C) KEGG pathway enrichment analysis of the 7647 SPS deregulated by teratogens. The ten KEGG pathways with the lowest adj. p-values are given. Full names and complete KEGG-pathway lists are given in the Supplementary Excel-file 2. ‘‘Count:’’ number of significant genes from A linked to the KEGG pathway. ‘‘Gene Ratio:’’ percentage of significant genes associated with the pathway compared to the number of all significant genes associated with any pathway. (D) The ten GO groups with the lowest adj. p-values from all significantly (adj. p-value < 0.05) overrepresented GO groups in the 7647 SPS deregulated by teratogens. The names of the GO groups have been shortened. Full names and complete GO group lists can be found in the Supplementary Excel-file 3. ‘Count:’ number of significant genes from A linked to the GO group. ‘Hits:’ percentage of significant genes compared to all genes assigned to the GO group.

