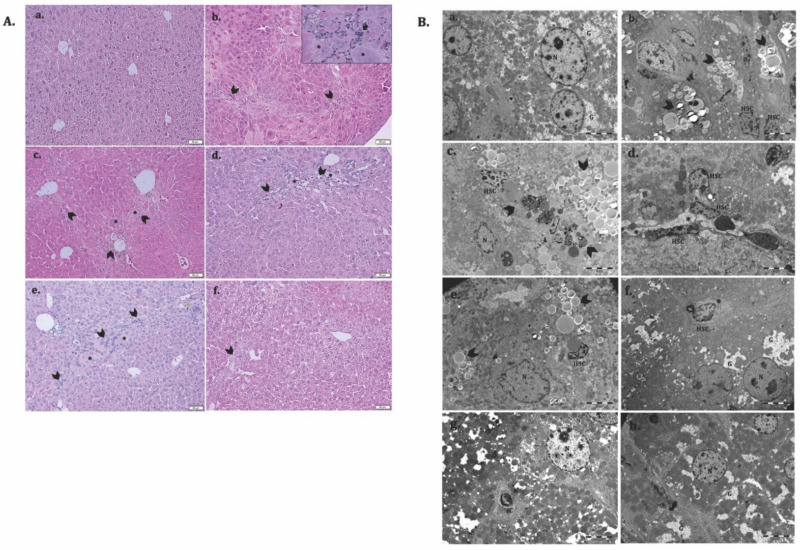
Figure 9.
ADSC and HGF cotreatment improve the liver structure and ultrastructure of the fibrotic liver in diabetic mice. (A). Representative light microscopy micrographs of liver histology in H&E stain: (a) Control; (b) LF group—liver fibrosis in diabetic mice; (c) LFC group—self-recovery of liver fibrosis (positive control) in diabetic mice; (d) ADSC group—ADSC treatment of liver fibrosis in diabetic mice; (e) HGF group—HGF treatment of liver fibrosis in diabetic mice; (f) ADSC + HGF group—ADSC and HGF cotreatment of liver fibrosis in diabetic mice; scale bar: 50 μm; fibrosis (arrowhead), foam hepatocyte (*), inflammatory infiltrate (arrow); (B). Representative electron microscopy micrographs of the liver for the experimental groups; (a) control, (b–d) LF group, (e) LFC group, (f) ADSC group, (g) HGF group, (h) ADSC + HGF group. N-hepatocyte’s nuclei; HSC—hepatocyte stellate cells; lipids (arrowhead); collagen (*); glycogen (G).

