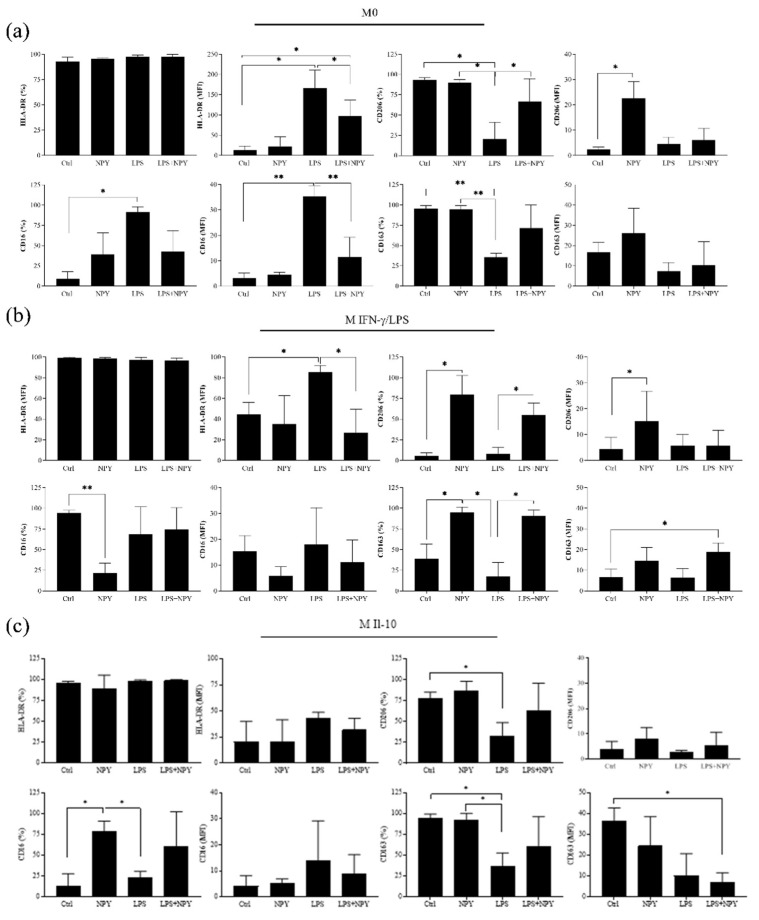
Figure 2.
Flow cytometric analysis of the M1 markers HLA-DR and CD16 and the M2 markers CD206 and CD163 on (a) M0, (b) polarized M(IFN-γ/LPS), and (c) polarized M(IL-10) macrophages. Macrophages (7 × 10⁵ cells per mL) were stimulated or not with 10−8 M NPY in the presence or absence of LPS in complete medium for 24 h and then analyzed for surface marker expressions by flow cytometry. Histograms show the percentages of positive cells (%) and the mean fluorescence intensity (MFI). Results are expressed as mean value ± SD of 4 independent experiments. Significance was determined by one-way ANOVA followed by Tukey’s post hoc analysis; *: p < 0.05, **: p < 0.01.

