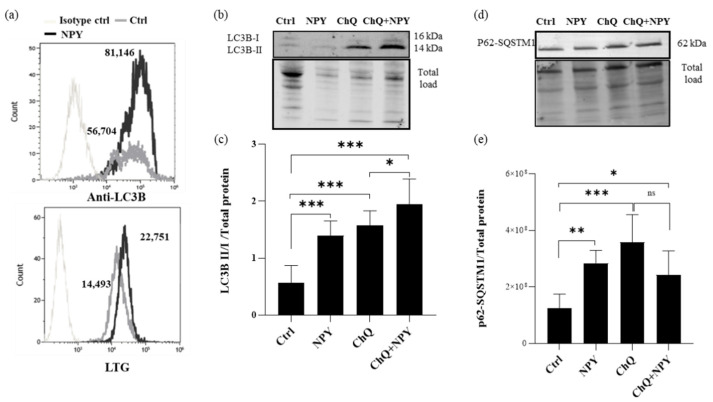
Figure 6.
Flow cytometry and Western blotting analysis of autophagy markers in M0 macrophages treated with 10−8 M NPY for 24 h. (a) Representative flow cytometric analysis of autophagic marker LC3B and lysosomal dye LysoTracker (LTG) signals in M0 macrophages treated with 10−8 M NPY for 24 h. Cells were labeled with anti-LC3B-Alexa Fluor488 or isotype-Alexa Fluor488 or 10 µM LTG. Histogram overlays of LC3B or LTG expression of isotype control cells, untreated, and NPY-treated cells are shown. Median fluorescence intensity (MFI) values are indicated. (b–e) Western blotting analysis of LC3B and p62/SQSTM1 were performed in the whole-cell lysates of macrophages. Densitometric analysis of LC3BI/II panel (c) and p62/SQSTM1 (e) in M0 macrophages. Analyses were performed with ImageLab software (Biorad) and normalized to total protein. Data are expressed relative to the control total protein as mean ± SD of 6 independent experiments. Significance was determined by one-way ANOVA followed by Tukey’s post hoc analysis; *: p < 0.05, **: p < 0.01, ***: p < 0.001. Panel (b) and (d) show representative Western blotting results of LC3B and p62/SQSTM1, respectively.

