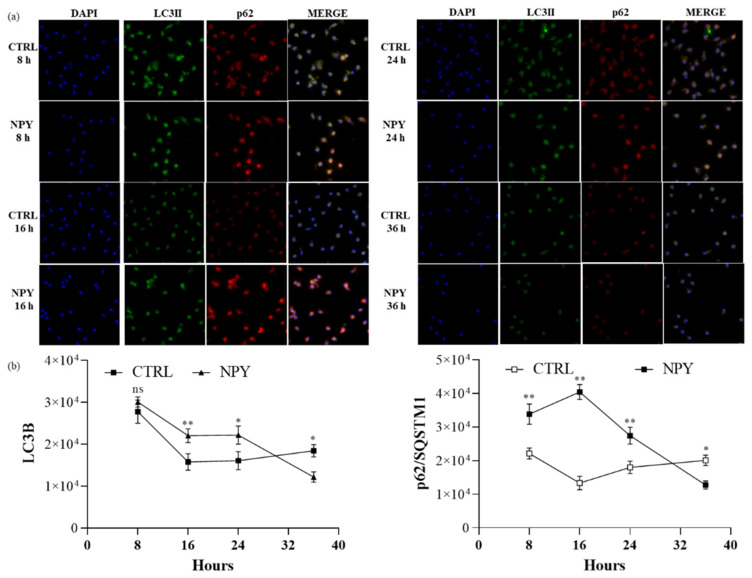
Figure 7.
Immunofluorescent analysis of LC3B and p62/SQSTM1 expression in M0 macrophages at different time points after 10−8 M NPY exposure. (a) Representative immunofluorescent co-staining of LC3B and p62/SQSTM1. (b) Quantification of the intensity of the fluorescence signal for LC3B and p62 positive cells. DAPI was used to counterstain the nuclei. The upright microscope Nikon Eclipse Ni-U with 60× magnification was used to capture micrographs. Immunofluorescence analysis was performed using the ImageJ software. Data are presented as the mean ± SD for each group (N = 3). Significance was determined by one-way ANOVA followed by Tukey’s post hoc analysis; *: p < 0.05, **: p < 0.01.

