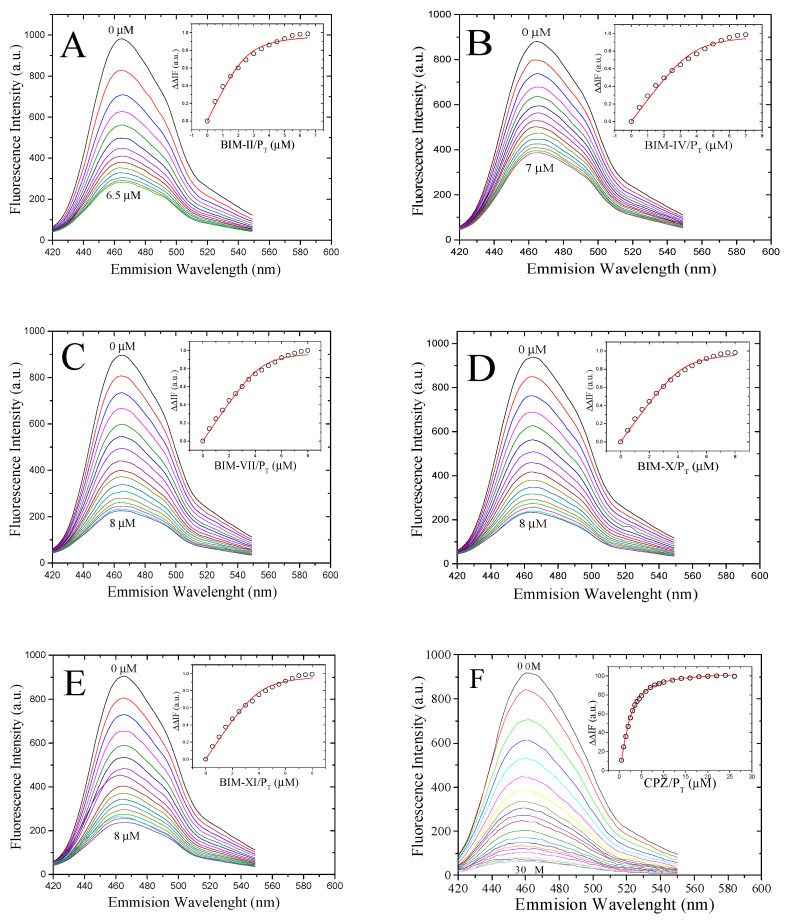
Figure 3.
Fluorescence spectra and titration curves of Ca+2-hCaM M124C-mBBr with BIM-II (A), BIM-IV (B), BIM-VII (C), BIM-X (D), BIM-XI (E), and CPZ (F). Buffer was 10 mM of potassium acetate pH 5.1 at 37 °C. The absolute changes of maximal fluorescence emission were corrected for light scattering effects and plotted against the ligands to total protein ratio (insets). The continuous line in the insets comes from data fitting to the binding model (Equation (1) in the experimental section) to obtain the Kd.

