Figure 3.
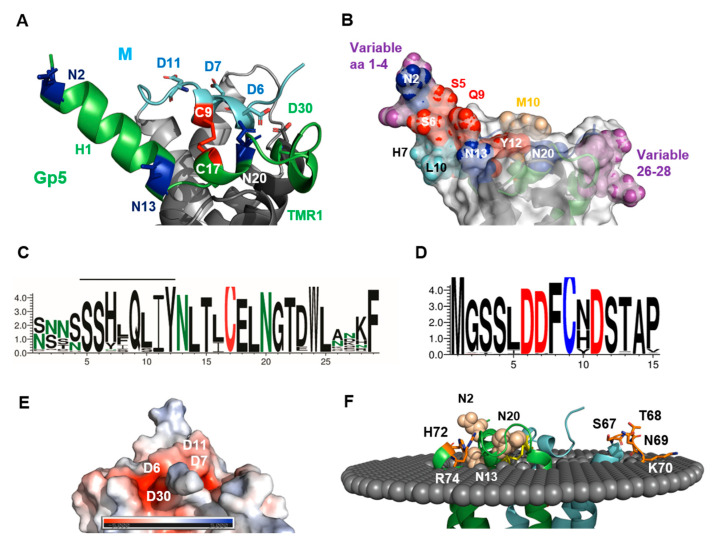
The structure of the ectodomain of Gp5/M of PRRSV-2. (A) Cartoon model. Hydrophilic residues in Gp5 are colored green and in M are colored cyan. Hydrophobic membrane parts of Gp5 are colored dark grey and of M are colored light grey. N-glycosylated Asn are shown as blue sticks, residues forming the disulfide bond between Gp5 and M are shown as red sticks and Asp residues in Gp5 and M are shown as green and cyan sticks, respectively. (B) Surface representation of the ectodomain. N-glycosylation sites are shown as blue spheres, and between PRRSV-2 strains, variable amino acids are shown as magenta spheres. The neutralizing epitope (residues 5–12) is also highlighted, conserved residues are highlighted as red spheres and the between strains variable residues are highlighted as cyan spheres. Residue 10 of M, which is also involved in antibody binding, is shown as a wheat sphere. (C,D) Web logo showing the amino acids at each position in the ectodomain of Gp5 (C) and M (D). Logos were generated from 7701 aligned Gp5 and 290 aligned M amino acid sequences from PRRSV-2 strains. The overall height of the stack indicates the sequence conservation at a position (x-axis), while the height of symbols within the stack indicates the relative frequency of each amino. Asn residues are labeled green, Cys is labeled red (C) or blue (D) and Asp residues are labeled (D) in red. The neutralizing epitope in Gp5 is highlighted by a black line. (E) Electrostatic surface potential of the Gp5/M ectodomain. The location of negatively charged Asp residues is indicated. The structure is rotated clockwise by 90° relative to the structure shown in A. The scale bar indicates the electrostatic surface potential from −5 (deep red) to +5 (deep blue). (F) Integration of Gp5/M into a virtual lipid bilayer. The border between the hydrophobic and hydrophilic part of the external part of the bilayer is shown as grey spheres. Gp5 and M are shown as green and cyan cartoons, respectively. The N-glycosylation sites are shown as wheat spheres, and amino acids located in the loop between transmembrane helices 2 and 3 of both Gp5 and M and protruding from the membrane are shown as orange sticks.

