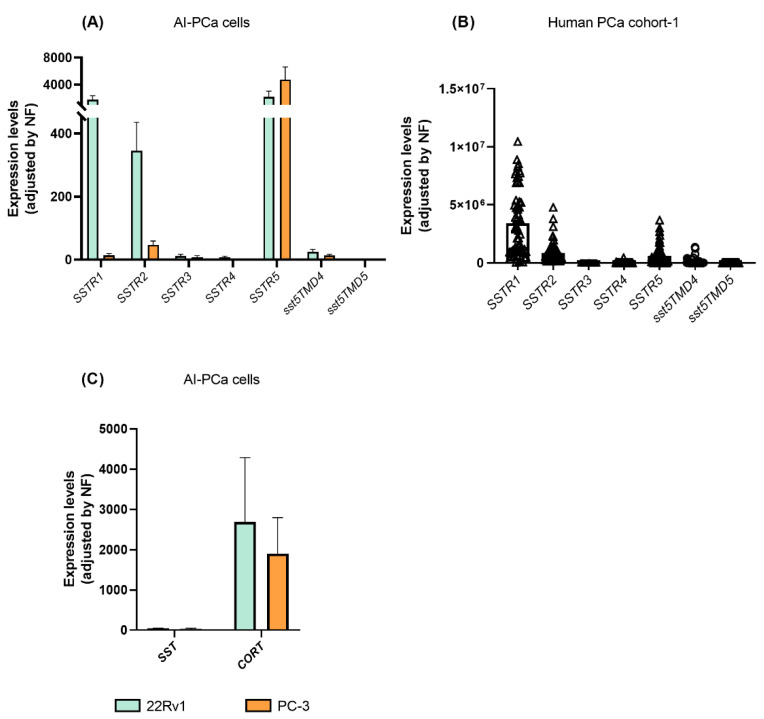
Figure 3.
Expression profile of somatostatin-system [receptors (SSTRs), and ligands (somatostatin-SST and cortistatin-CORT)] in androgen-independent (AI) prostate cancer (PCa) cells and fresh prostate tissue (n = 69; cohort-1). (A) Expression of SSTRs in 22Rv1 and PC-3 AI-PCa cells. (B) Expression of SSTRs in PCa fresh samples. (C) Expression of SST and CORT in AI-PCa cells. Data represent the mean of mRNA copy number ± Standard Error of the Mean (SEM). mRNA levels were determined by quantitative polymerase chain reaction and adjusted by normalization factor (NF).

