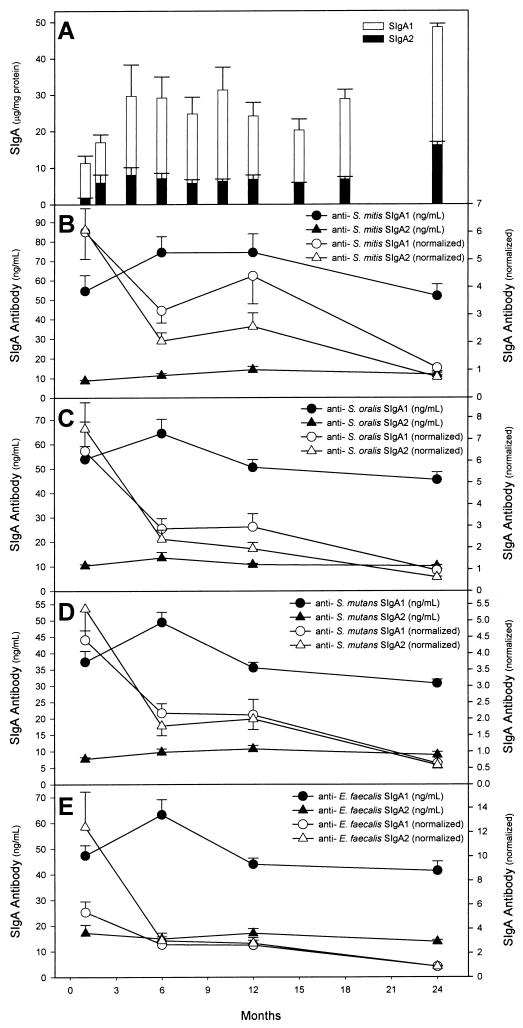
FIG. 1.
(A) Concentrations of salivary SIgA1 and SIgA2 from birth to 2 years of age. Results here and in panels B to E are expressed as means ± standard errors of the means. (B to E) Concentrations of SIgA1 and SIgA2 antibodies reactive with S. mitis biovar 1 (B), S. oralis (C), S. mutans (D), and E. faecalis (E) in saliva. The same data are also expressed as nanograms of antibody per microgram of SIgA1 or SIgA2 (normalized).

