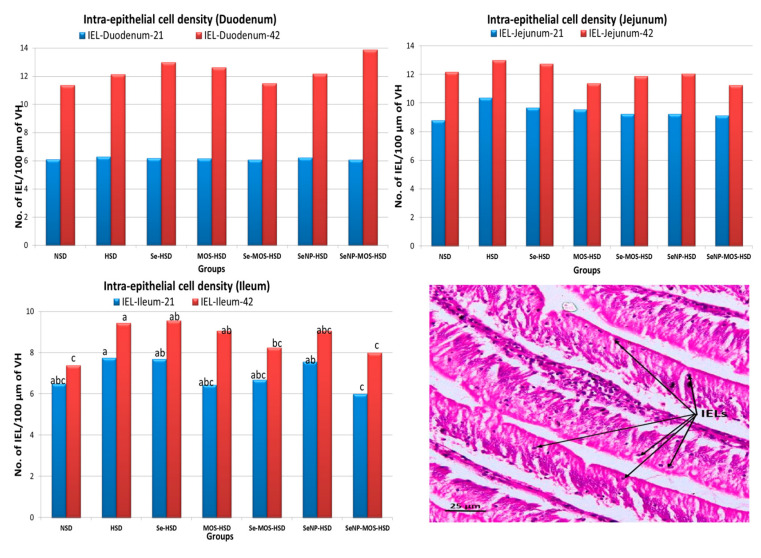
Figure 1.
Graphs comparing the intra-epithelial lymphocyte (IEL) density in the segments of small intestine on day 21 and day 42 among groups. The bar height shows the number of intra-epithelial lymphocytes (IEL) per 100 µm of the middle portion of villus height in the two-dimensional image. These values represent the means of eight replicates per group (16 birds per group). NSD: normal stocking density, HSD: high stocking density, Se: selenium selenite, MOS: mannan oligosaccharide, SeNP: selenium nanoparticles. PCNA: proliferating cell nuclear antigen bar of the same color with different letters differs significantly between groups. The micrograph in the right lower corner shows arrowed IELs. (H–E stained, 40×).

