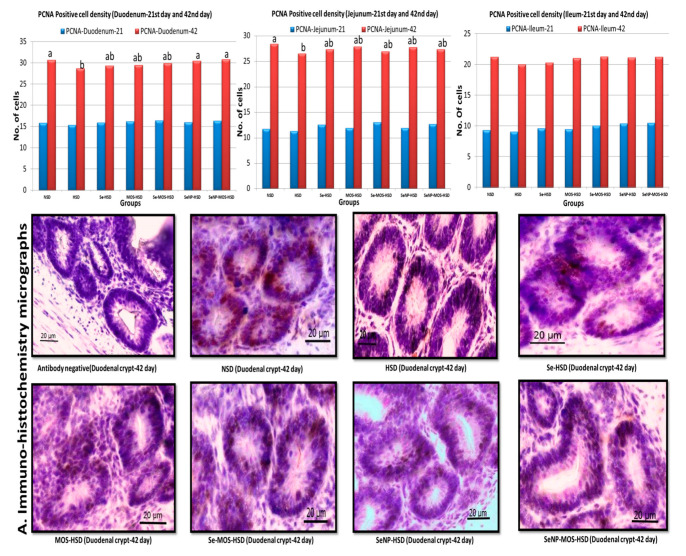
Figure 2.
Graphs comparing the proliferating cell nuclear antigen-positive cell density in the segments of small intestine on day 21 and day 42 among groups. The data bar height shows the number of PCNA-positive cells per crypt in the two-dimensional image. These values represent the means of eight replicates per group (16 birds per group). NSD: normal stocking density, HSD: high stocking density, Se: selenium selenite, MOS: mannan oligosaccharide, SeNP: selenium nanoparticles. PCNA: proliferating cell nuclear antigen bar of the same color with different letters differs significantly between groups. A. Immuno-histochemistry micrographs (40×) showing proliferating cell nuclear antigen positive cells in duodenal crypts.

