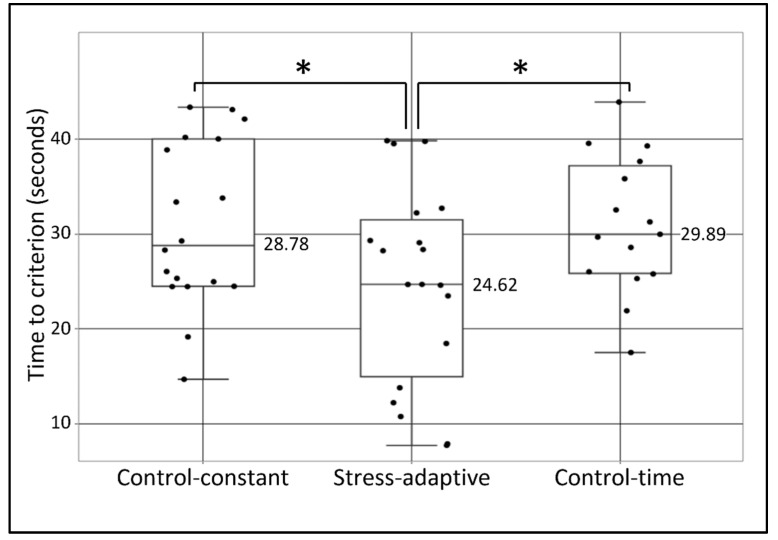
Figure 4.
Time to criterion as a function of group. Dots represent the “time to criterion” parameter (from the first derivative cutoff points) for all 52 participants, grouped according to their experimental condition (control-constant, stress-adaptive, and control-time). Boxes represent the inter-quartile range (IQR = Q1 to Q3) of the group, middle horizontal line represents the group’s median, upper line represents the largest value less than upper quartile plus 1.5 times IQR, and the lower line represents the smallest value greater than lower quartile minus 1.5 times IQR. One asterisk represents significance level of p ≤ 0.05.

