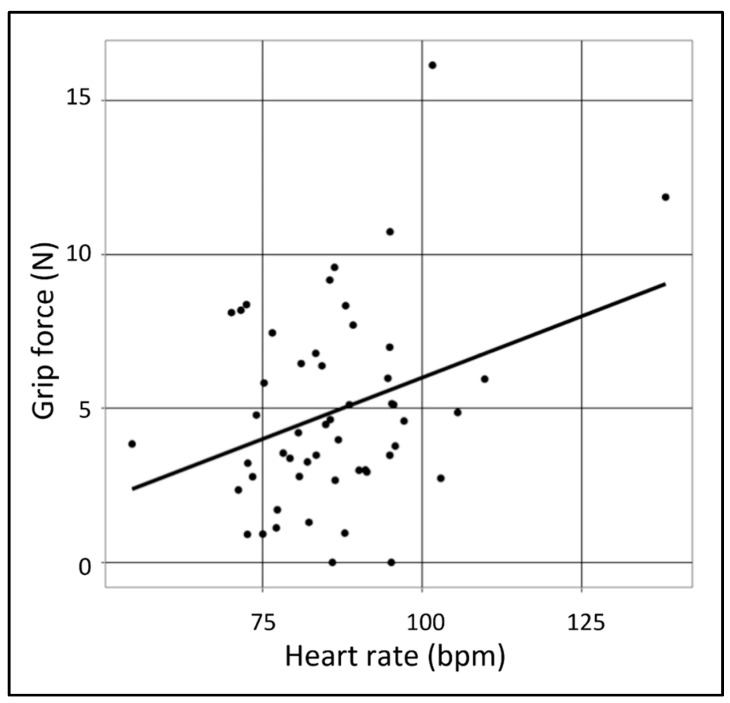
Figure A1.
Grip force as a function of heart rate. The plot illustrates the significant correlation where X-axis values represent the mean heart rate (bpm), and the Y-axis values represent mean grip force (N). Dots represent individual observations (each participant’s values). Line represents smoothed conditional means using lm smoothing.

