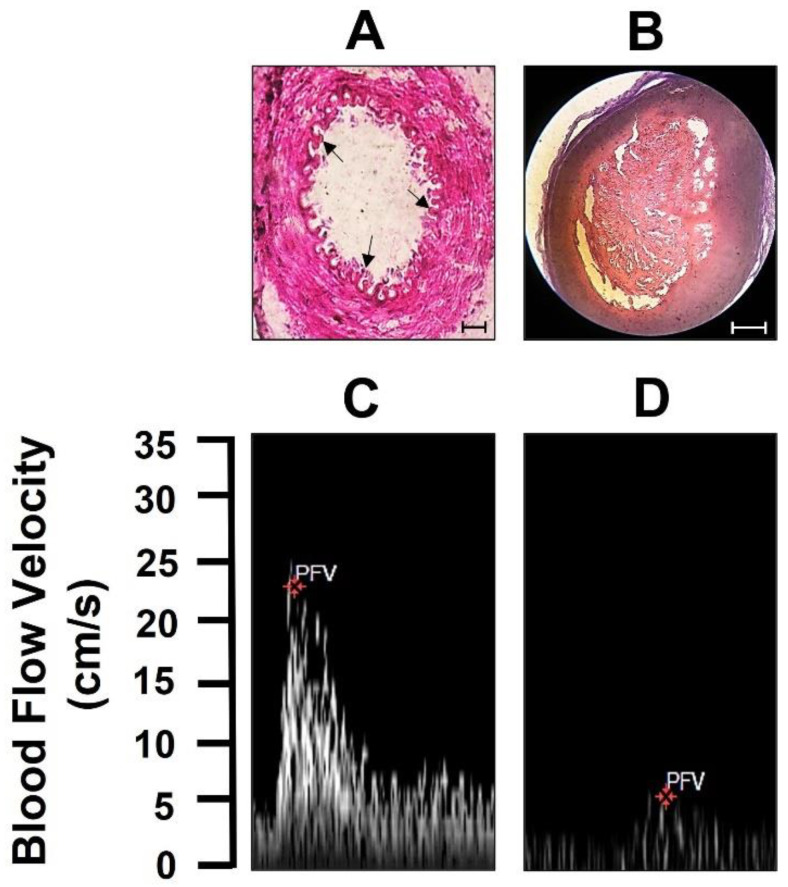
Figure 4.
Femoral thrombus presence. (A) The upper panel shows pictures of the HE staining of the control femoral artery and (B) the presence of thrombus in the femoral artery (scale bar 100 μm). The lower panel shows femoral artery blood flow velocity (C) before and (D) after thrombus generation. Each trace or picture shows one experiment with 5 animals.

