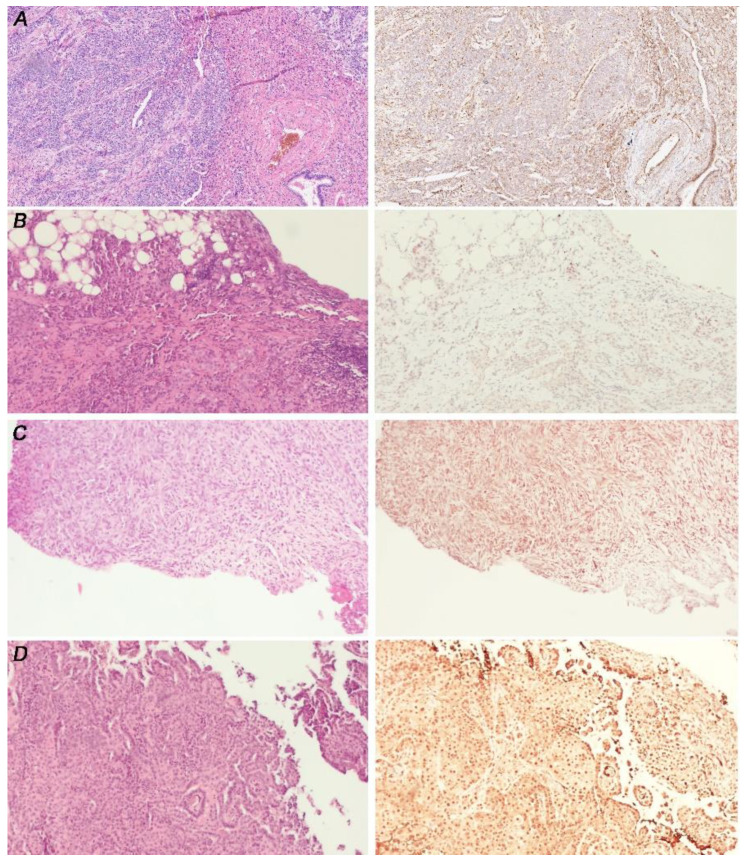
Figure 5.
IHC analysis of nuclear GLI1 in MPM FFPE. Magnification 10X. From left to right: haematoxylin and eosin staining, Gli1 immunostaining. (A) Epithelioid MPM, negative staining scored 0; (B) Epithelioid MPM, faint staining scored 1; (C) Biphasic MPM, moderate staining scored 2; (D) Epithelioid MPM, strong staining scored 3.

