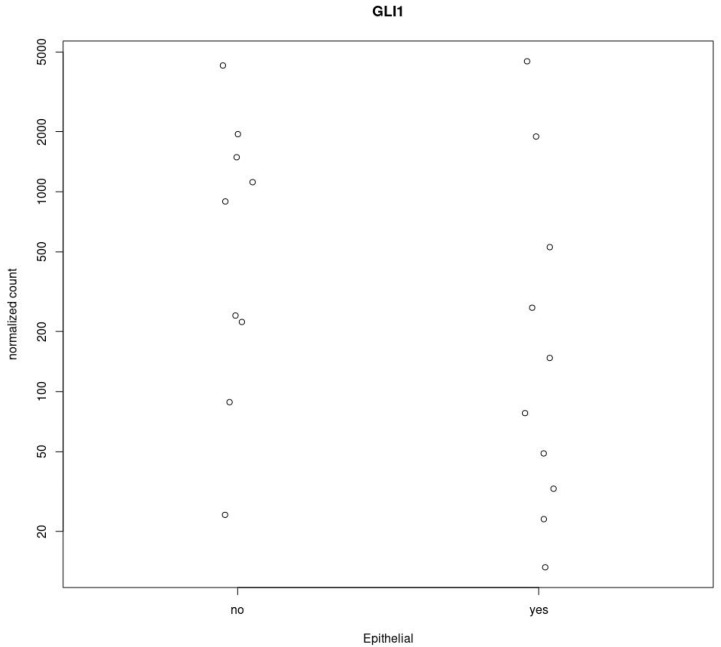
Figure 6.
Differential expression analysis of GLI1 gene between biphasic and epithelioid MPM. The analysis was drawn using the Deseq2-package, PlotCounts. The GLI1 gene has Log2FoldChange < 0, indicating that the gene is down-regulated in epithelial tissues, but it is not significantly differentially expressed since padj = 0.81. Y axis: normalized count; X axis: Histological subtype. Epithelial = yes; non-epithelial = no.

