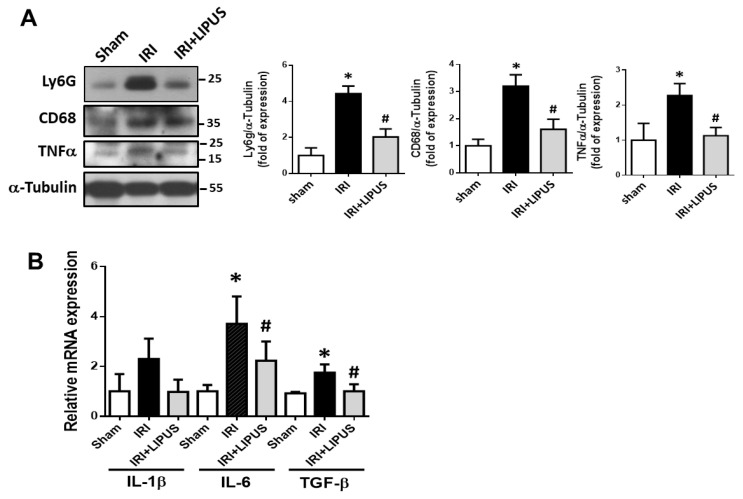
Figure 4.
The effects of LIPUS on inflammatory cell infiltration in the kidneys of IRI-CKD mice: Ly6G, CD68, and TNF-α protein expression levels in the kidneys, determined by Western blot (A); IL-1β, IL-6, and TGF-β mRNA expression levels in the kidneys, determined by real-time PCR (B). Data are presented as mean ± SD (n = 4–6): * p < 0.05 versus the control group; # p < 0.05 versus the IRI-CKD group.

