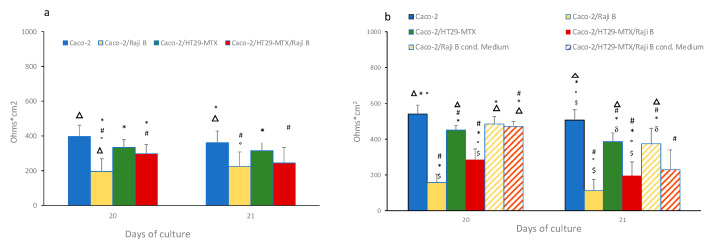
Figure 6.
TEER evaluation in 1 (a) and 3 (b) µm pore size insert at 20th and 21st days of culture. Results are the mean of three separate experiments performed in triplicate. Statistical analysis has performed by One-way Anova Test followed by post hoc test (Tukey’s (p < 0.05) to evaluate group comparison. # versus Caco-2, * versus Caco-2/RajB; ° versus Caco-2/HT29-MTX; Δ versus Caco-2/HT29-MTX/ Raji B, $ versus Caco-2/Raji B medium; δ versus Caco-2/HT29-MTX/ Raji B medium.

