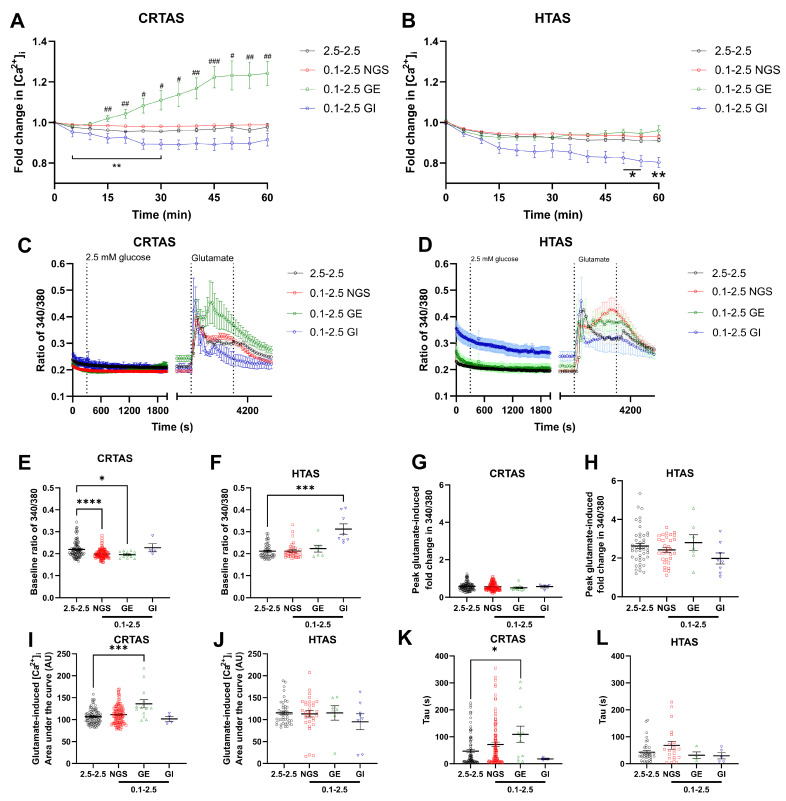
Figure 3.
Reversal of low glucose-induced calcium response by return to normal glucose. Primary cortical (CRTAS) and hypothalamic (HTAS) astrocytes were loaded with Fura-2 calcium sensitive dye for 1 h in either 2.5 mmol/L glucose (CRTAS n = 98 cells across 6 coverslips; HTAS n = 48 across 5 coverslips) or 0.1 mmol/L glucose (CRTAS n = 137 cells across 7 coverslips; HTAS n = 36 across 6 coverslips) before calcium imaging. After 6 min of baseline measurement cells glucose levels were maintained or increased to 2.5 mmol/L for 1 h. Cells were then treated with glutamate (100 µmol/L) for 3 min before washout and termination of imaging. Cells that had a delta in signal from the previous 5 min more than the average of the controls +/−2.5 standard deviations were determined to be glucose-excited-like (CRTAS n = 14; HTAS n = 7) or glucose-inhibited-like (CRTAS n = 4; HTAS n = 8), respectively. The ratio of 340/380 indicating [Ca2+]i in CRTAS (A), and HTAS (B). The ratio of 340/380 values were binned using the 30 s of recording either side of each 5-min time point for CRTAS (C) and HTAS (D). Basal [Ca2+]i of CRTAS (E) and HTAS (F). The fold change of glutamate-induced increase in the ratio of 340/380 of CRTAS (G) and HTAS (H). The area under the curve of glutamate-induced increases in [Ca2+]i in CRTAS (I) and HTAS (J). The tau value for the decay in calcium signal induced by glutamate stimulation in CRTAS (K) and HTAS (L). * p < 0.05; ** p < 0.01; *** p < 0.001 **** p < 0.0001 denote significant difference between NGS-cells and control or groups designated. # p < 0.05, ## p < 0.01 and ### p < 0.001 denote significant difference between GE-cells and control. Error bars represent standard error of the mean. Kruskall-Wallis tests with post hoc Dunn’s tests. Two-Way ANOVA with post hoc Dunnett’s multiple comparisons test. Circles, squares, green triangles and blue triangles denote control, NGS, GE- and GI-like cells, respectively.

