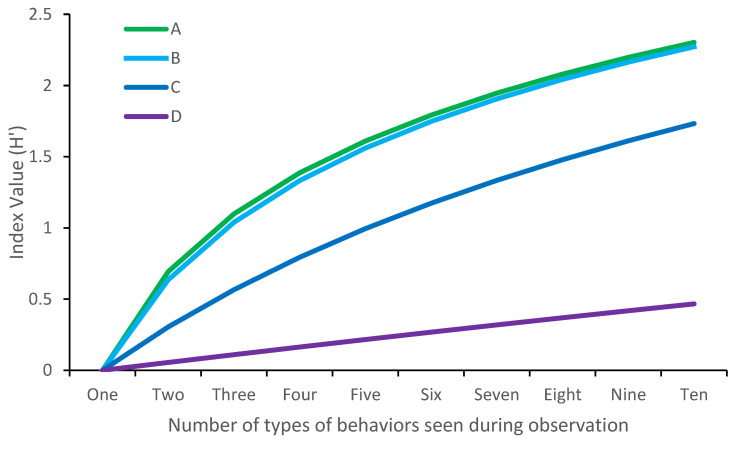
Figure 1.
The effect of number of behaviors seen on Shannon–Wiener index outputs, using simulated data. Simulation A demonstrates H’ outputs when all behaviors are seen an equal number of times. Simulation B, C and D demonstrate H’ outputs when all behaviors occur equally frequently, apart from the first behavior which occurs 2×, 10× or 100×, respectively, more frequently than the others.

