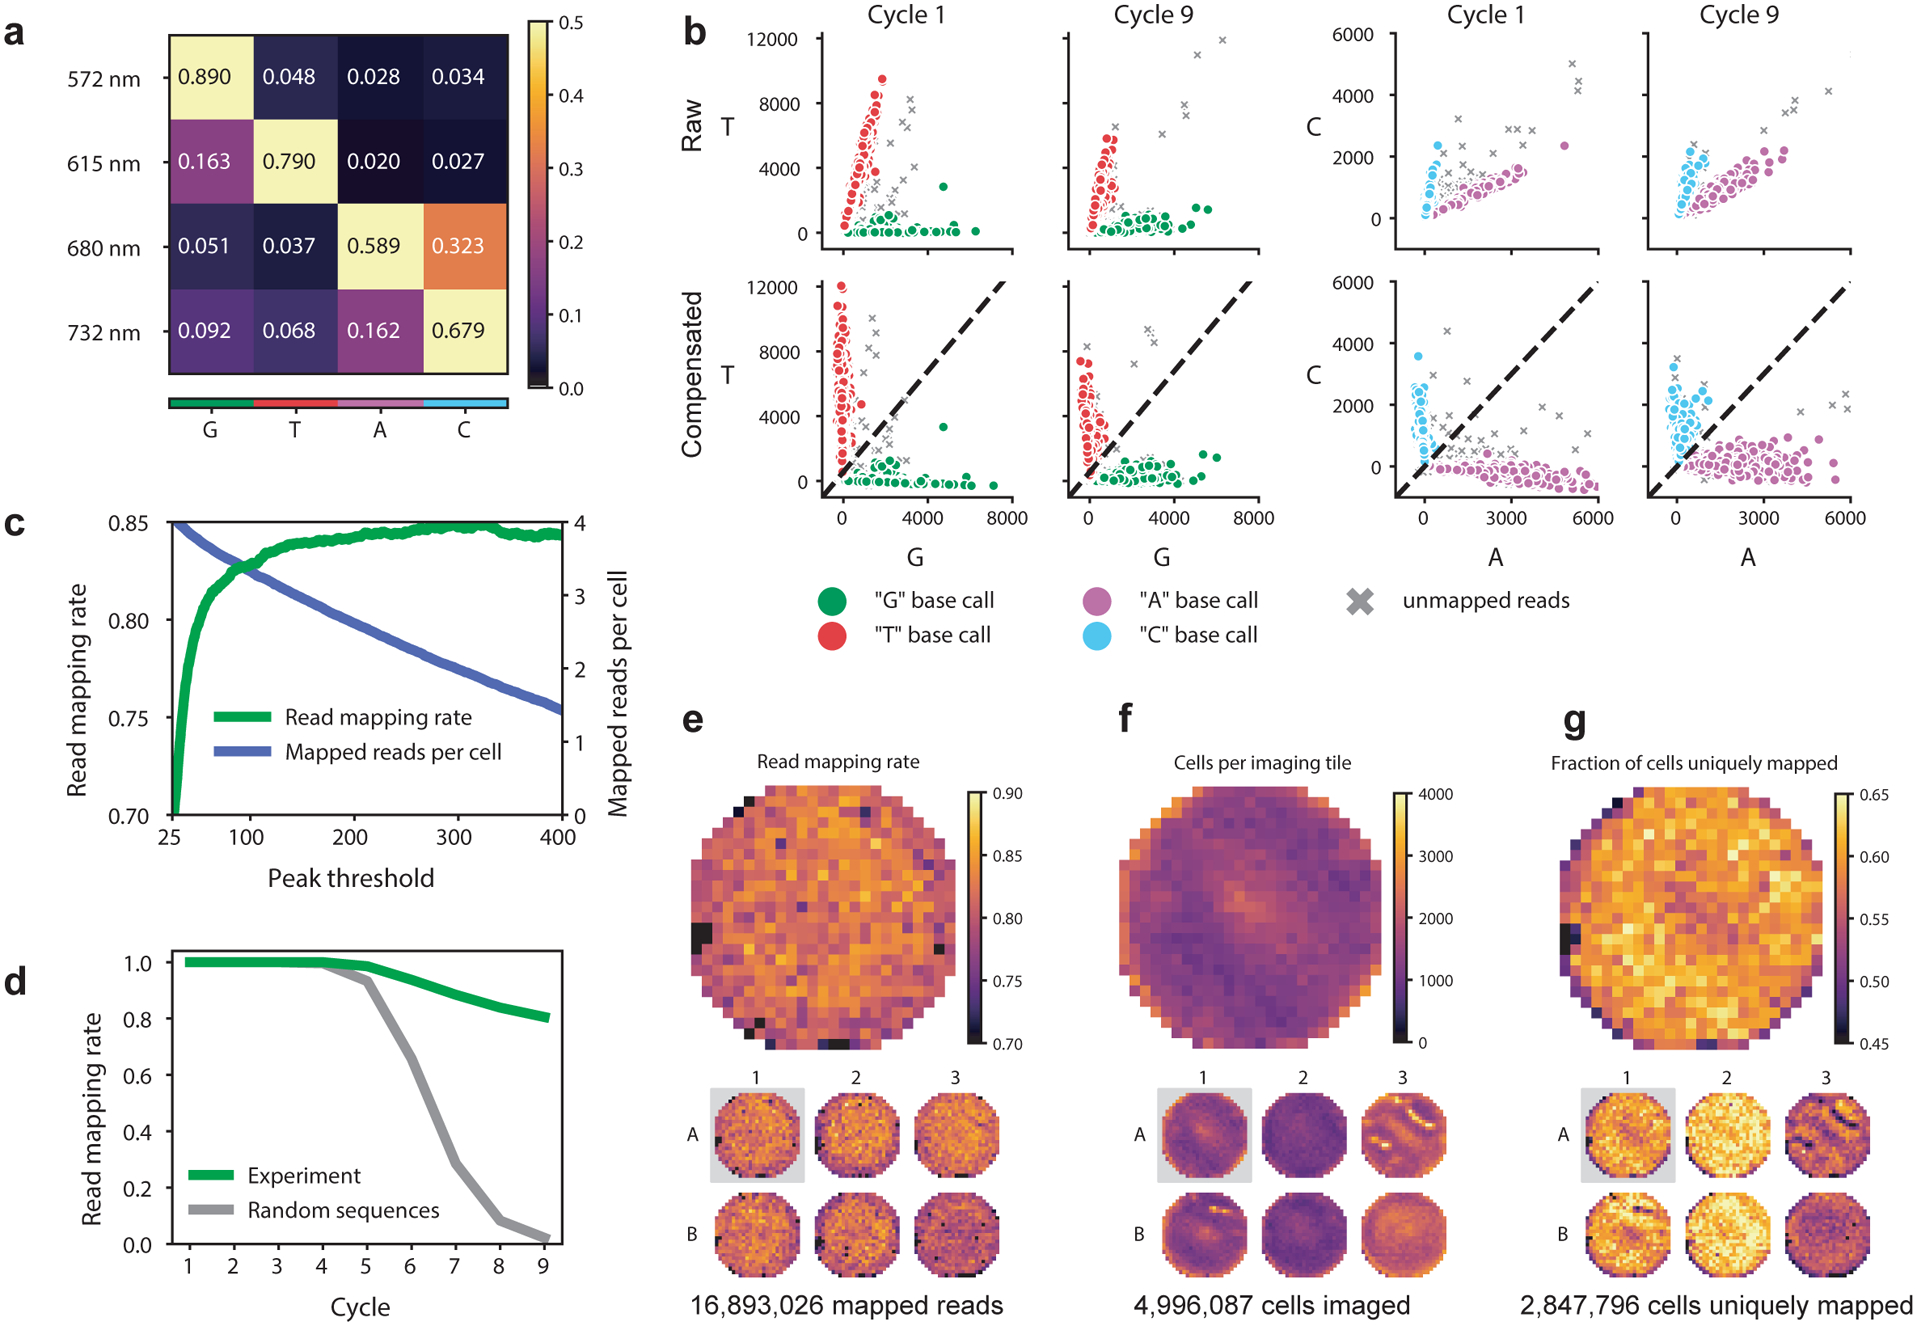
Figure 3.

Technical performance and quality control of in situ sequencing by synthesis (SBS). Data are from a screen in A549 cells with a CROPseq-puro library of 5,738 sgRNAs43. (a) Example compensation matrix used for correcting spectral cross-talk between SBS imaging channels. (b) Spectral compensation of the two-channel combinations with the most cross-talk (T vs G and C vs A) at the first and last cycle of an SBS experiment. Mapped reads are those with barcode sequences exactly matching expected sequences from the designed sgRNA library. Dotted lines in the compensated plots demarcate the decision boundary for base calling. (c) Plotting read mapping rate and mapped reads per cell against increasing thresholds on the peak parameter demonstrate that most non-mapping reads are excluded by thresholding this value. (d) Longer read lengths provide increased confidence of mapped reads representing true sequencing spots from barcode mRNA. Plotting plate heatmaps of quality control metrics such as read mapping rate (e), total cells imaged (f), and fraction of cells with reads mapping to one expected barcode sequence (g) is useful for evaluating the quality of an experiment and identifying potential issues.
