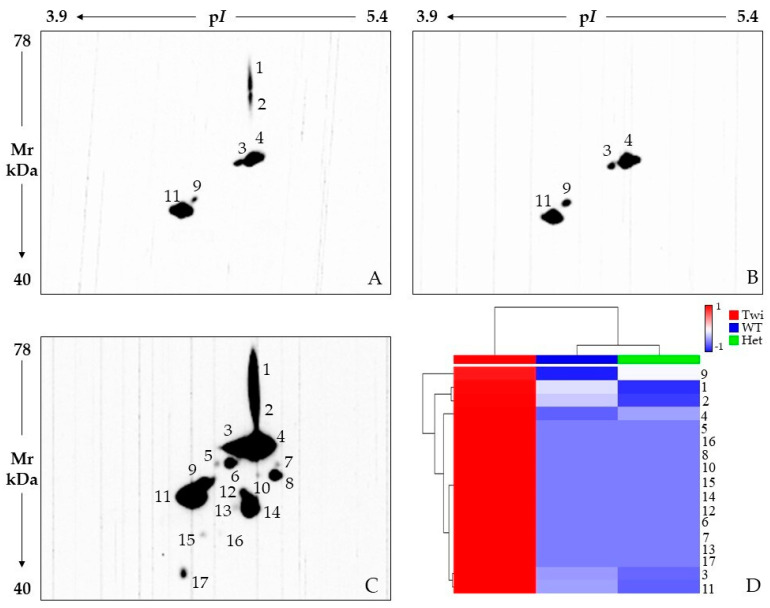
Figure 5.
2D Western blot analysis with anti-vimentin antibody on 33-day-old wild-type (WT) (A), heterozygous galc +/− (Het) (B) and twitcher galc −/− (Twi) (C) mice. Heatmap analysis (D) scaled values of spot intensity. Color changes from blue to red indicate less or higher signal intensity, respectively. Each row corresponds to a VIME protein species while each column corresponds to one of the three tested conditions, as highlighted by the colored bar from the horizontal dendrogram: Twi = red, WT = blue, and Het = green. Row spot numbers match those in (A–C).

