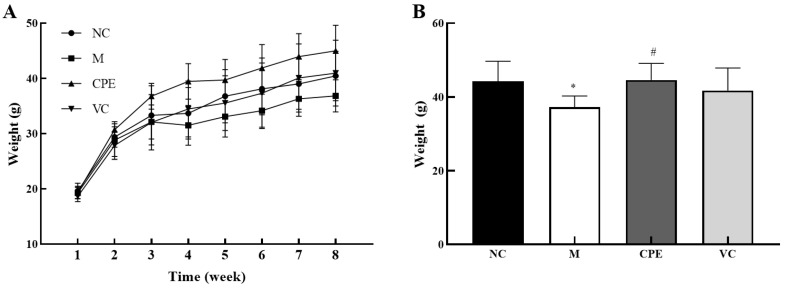
Figure 2.
Body weight changes of mice during the experiment. Note: (A): the weight growth of mice during the experiment; (B): the weight of mice at the eighth week. “*” indicated that the date had statistically significant differences (p < 0.05) compared with group NC. “#” indicated that the date had statistically significant differences (p < 0.05) compared with group M. NC, negative control group; M, model group; CPE, treatment group; VC, positive control group.

