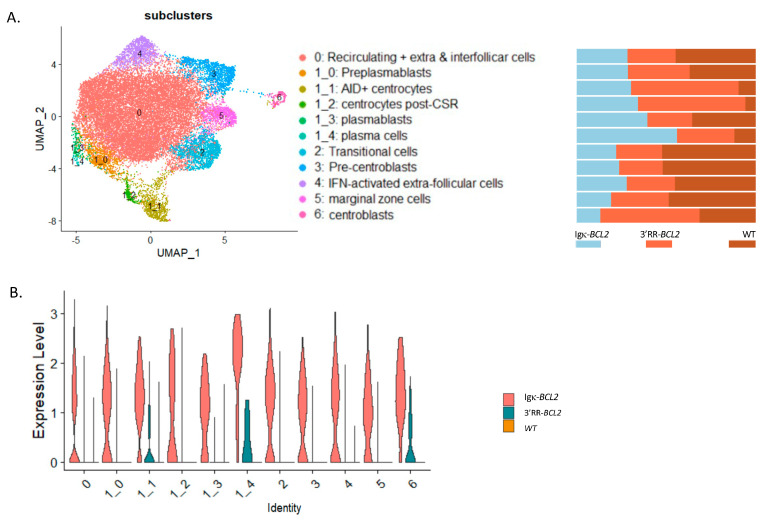
Figure 5.
Single-cell RNAseq analysis of splenocytes from immunized mice: (A, left panel) UMAP of the 10× single cell analysis of spleen B-cells 10 days after SRBC immunization, split into 12 clusters (as defined in Supplementary Figure S2). (A, right panel) Quantitative variations in cell numbers in the various clusters in Igκ-BCL2 and 3′RR-BCL2 mice compared to WT. (B) Human BCL2 expression level in the various cell clusters in Igκ-BCL2 and 3′RR-BCL2.

