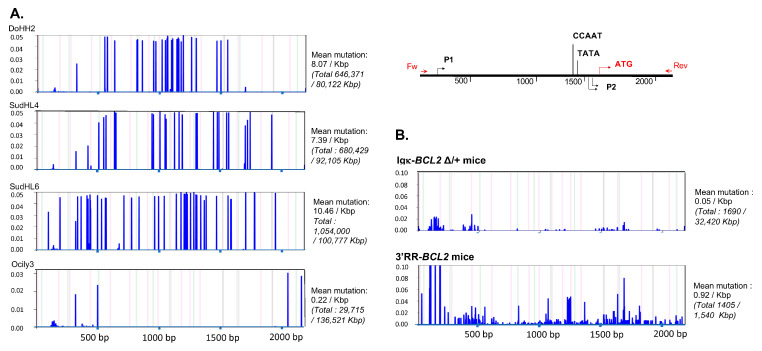
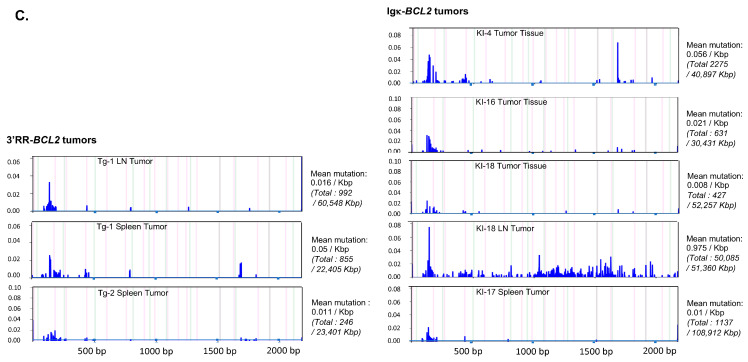
Figure 8.
Mutation in the Bcl2 promoter region. Graphs showing the frequency and the localization/distribution of mutations along the BCL2 promoter region (after high-throughput sequencing) as well as the global mutation rate and the mutation enrichment in AID-hotspots in several human DLBCL cell lines as positive controls (A), in total splenocytes or class-switched versus non-class-switched splenocytes of immunized mice (3 iterative immunizations or single 7-day immunization, respectively) from both BCL2 models (B) and finally in various tissues/organs from several tumoral mice of both BCL2 models (C). Graphs are shown as generated by the system Deminer after correction with respect to two negative controls passed on the same run.


