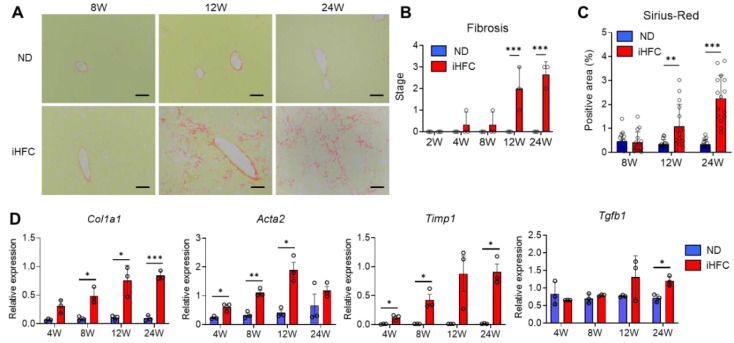
Figure 2.
The iHFC diet induces advanced fibrosis in the liver of TSNO mice. (A) Representative images of Sirius red-stained sections of the livers from TSNO mice fed with the ND or iHFC diet for the indicated time periods. Scale bars, 100 μm. (B) Liver fibrosis (0 to 4) was assessed according to the criteria proposed by Kleiner et al., as described in the Materials and Methods (n = 3 per group). (C) Five locations were photographed per three sections per each group. Then, positive areas for Sirius red were measured at 15 locations using ImageJ software, and the mean and SD were calculated. (D) RT-qPCR of collagen type 1 (Col1a1), αSMA (Acta2), TIMP-1(Timp1), and TGF-β (Tgfb1) mRNA in the livers from TSNO mice fed with the ND or iHFC diet for the indicated time periods (n = 3 per group). Data are shown as means ± SD. * p < 0.05, ** p < 0.01, *** p < 0.001. Statistical significance was evaluated by 2-way ANOVA followed by post hoc Sidak test.

