Figure 3.
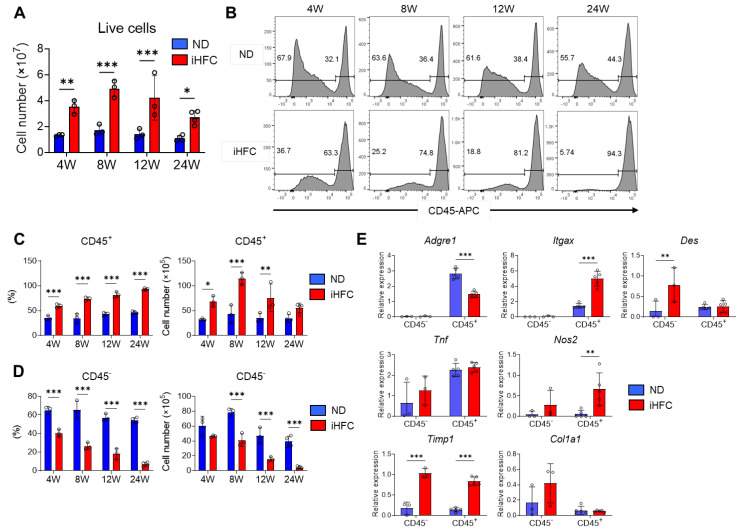
The iHFC diet induces the accumulation of CD45+ leukocytes in the liver of TSNO mice. (A) Cell number of live non-parenchymal cells of the livers from TSNO mice fed with the ND or iHFC diet for the indicated time periods (n = 3 or 4 per group). (B) Representative flow cytometry data of CD45 expression on live non-parenchymal cells of the livers from TSNO mice fed with the ND or iHFC diet for the indicated time periods. (C) Percentage (Left) and cell number (Right) of CD45+ live non-parenchymal cells were determined by flow cytometry analysis done in (B) (n = 3 or 4 per group). (D) Percentage (Left) and cell number (Right) of CD45- live non-parenchymal cells were determined by flow cytometry analysis done in (B) (n = 3 or 4 per group). (E) RT-qPCR of F4/80 (Adgre1), CD11c (Itgax), Desmin (Des), TNF-a (Tnf), iNOS (Nos2), collgen type 1 (Col1a1), and TIMP-1 (Timp1) mRNA in sorted CD45+ and CD45- cells from TSNO mice fed with the ND or iHFC diet for 8 weeks (n = 3 to 5 per group). Data are shown as means ± SD. * p < 0.05, ** p < 0.01, *** p < 0.001. Statistical significance was evaluated by 2-way ANOVA followed by post hoc Sidak test.

