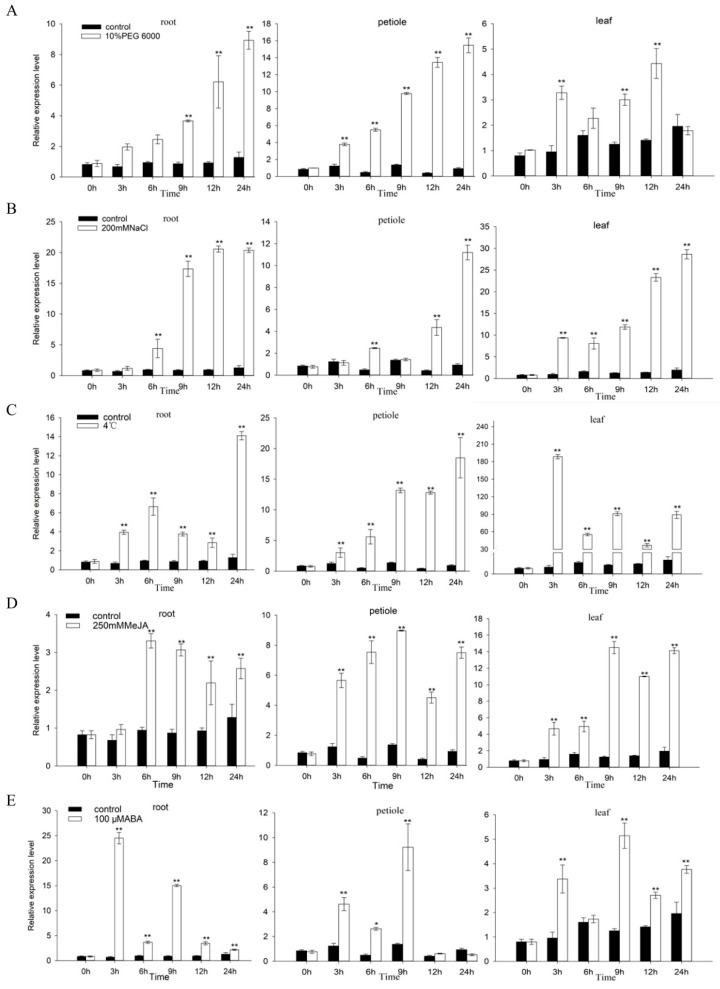
Figure 10.
Expression patterns of FaZAT10 under different abiotic stresses. The relative expression levels of FaZAT10 under drought (A), salt stress (B), and low-temperature treatments (C) and MeJA (D) and ABA (E) hormone treatments. Data contain three biological replicates, error bars represent the standard error of the mean, and significant differences between samples were determined using Student’s t-test (**, p < 0.01; *, p < 0.05).

