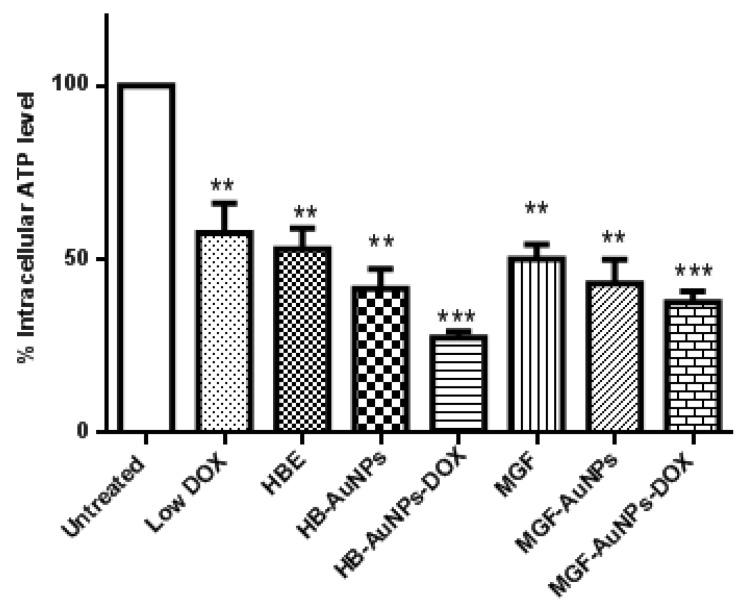
Figure 3.
Effect of treatments on intracellular ATP levels in Caco-2 cells. Cells were treated with Low DOX (1.56 µg/mL), MGF (1000 µg/mL), HBE (1000 µg/mL), MGF-AuNPs (1000 µg/mL), HB-AuNPs (1000 µg/mL), MGF-AuNPs-DOX (1000 µg/mL MGF-AuNPs and 1.56 µg/mL DOX) and HB-AuNPs-DOX (1000 µg/mL HB-AuNPs and 1.56 µg/mL DOX). ATP levels were assessed using the Mitochondrial ToxGlo assay. Notes: Results are expressed as mean ± standard error of the mean (SEM). n = 3. Data were considered statistically significant if p < 0.05, *** p < 0.001, ** p < 0.01.

