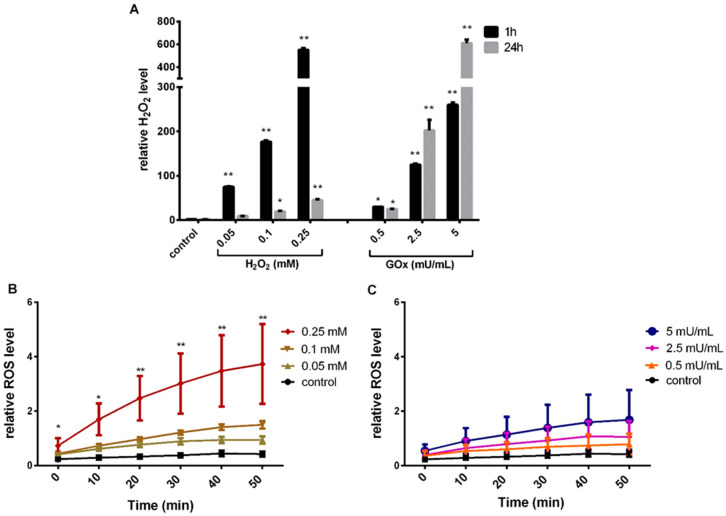
Figure 1.
Quantification of H2O2 in the cell culture medium and analysis of the formation of intracellular ROS. (A) Quantification of H2O2 in the cell culture medium treated with different concentrations of H2O2 and GOx for 1 and 24 h. (B) Intracellular ROS levels were quantified after treatment with different concentrations of H2O2 and (C) GOx for 50 min (data presented as bar graphs for H2O2 concentration measured from the fluorescent intensity with Amplex UltraRed, and ROS measured from relative fluorescence intensity normalized to cell count with CM-H2DCFDA ROS indicator, n = 5, mean and standard deviation of the mean, significance compared to the respective control, two-way ANOVA with Dunnett’s multiple comparison test, * p < 0.05, ** p < 0.001).

