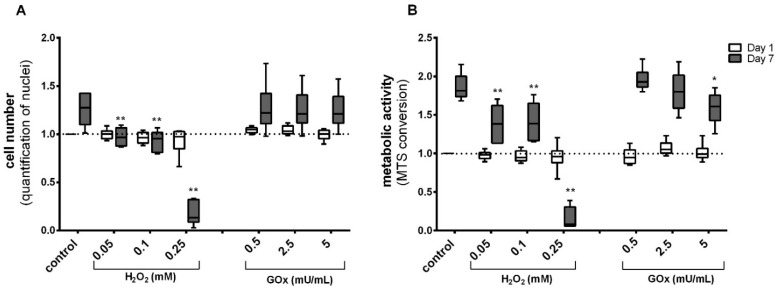
Figure 2.
The effect of H2O2 and GOx on (A) cell numbers and (B) metabolic activity after day 1 and day 7 of repeated treatment; ((A) cell number analyzed by quantification of nuclei upon staining with Hoechst H33342, (B) metabolic activity quantified by MTS conversion assay). The data set was normalized to the control on day 1 after the treatment; (n = 6, significance compared to the control group on the respective days of the treatment, two-way ANOVA with Dunnett’s multiple comparison test, * p < 0.05, ** p < 0.001).

