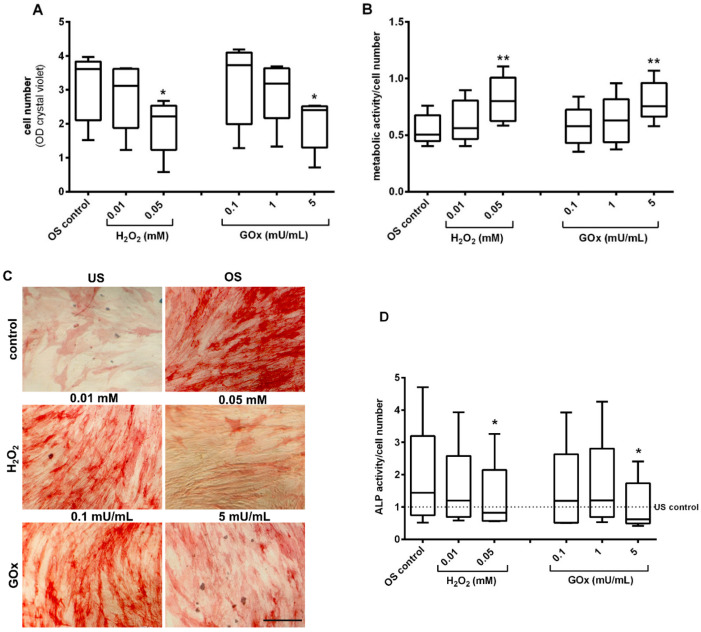
Figure 7.
Osteogenic differentiation in oxidatively stressed adMSC after 21 days. (A) Quantification of relative cell number in osteogenic stimulated (OS) adMSC (quantified with crystal violet staining) and (B) metabolic activity (quantified by MTS conversion assay related to the cell amount). (C) Microscopic depiction of ALP staining in untreated and unstimulated (US) control, untreated and OS control, OS adMSC treated with 0.01 mM and 0.05 mM H2O2, 0.1 and 5 mU/mL GOx, respectively (representative images, scale bar: 100 µm). (D) Quantification of ALP activity by p-Nitrophenyl Phosphate (pNPP) after 21 days of osteogenic stimulation and repeated treatment with different concentrations of H2O2 and GOx (normalized values to unstimulated control; n = 5, significance compared to the stimulated control; two-way ANOVA with Dunnett’s multiple comparison test, * p < 0.05, ** p < 0.001).

