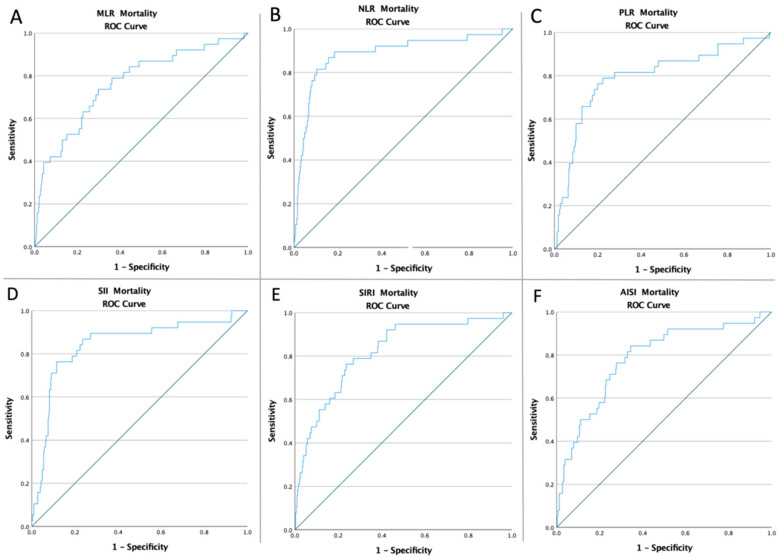
Figure 2.
ROC curve analysis concerning Mortality (A) for the MLR (AUC: 0.765; p < 0.0001), (B) for the NLR (AUC: 0.885; p < 0.0001), (C) for the PLR (AUC: 0.794; p < 0.0001), (D) for the SII (AUC: 0.844; p < 0.0001), (E) for the SIRI (AUC: 0.819; p < 0.0001), and (F) for the AISI (AUC: 0.784; p < 0.0001).

