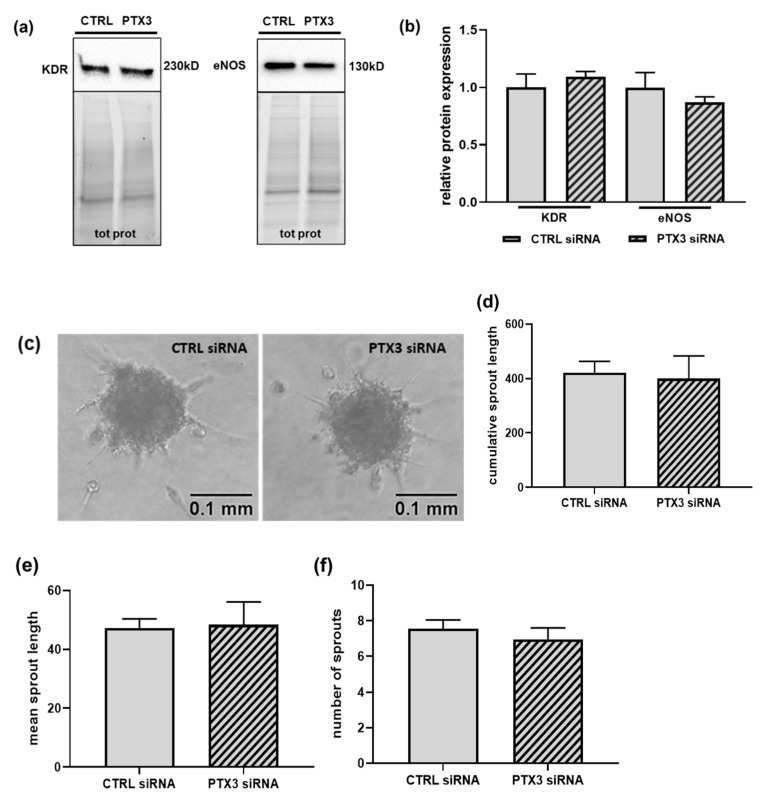
Figure 3.
The effect of silencing PTX3 on in vitro angiogenesis. ECs were transfected for 48 h with control siRNA (CTRL siRNA, solid bars) or PTX3 siRNA (diagonal bars). (a) Representative immunoblots of KDR (left panel) and eNOS (right panel) in lysates from CTRL or PTX3-silenced ECs normalized to the total protein content. Densitometric quantification is provided in (b). KDR, p = 0.498, n = 4; eNOS, p = 0.405, n = 3. (c) Representative images of spheroids from control ECs (CTRL siRNA) (left panel) or PTX3-silenced ECs (PTX3 siRNA) (right panel) embedded in collagen gels, as described in the “Materials and Methods” section. Photographs were taken 24 h later. Scale bar, 0.1 mm. Quantification of in vitro angiogenesis by measurement of the cumulative length, mean length, and number of all the processes in individual spheroids formed by ECs transfected with CTRL siRNA (solid bars) or PTX3 siRNA (diagonal bars) are shown in (d–f), respectively. Data are the mean ± SEM of 20 randomly selected spheroids for experimental group.

