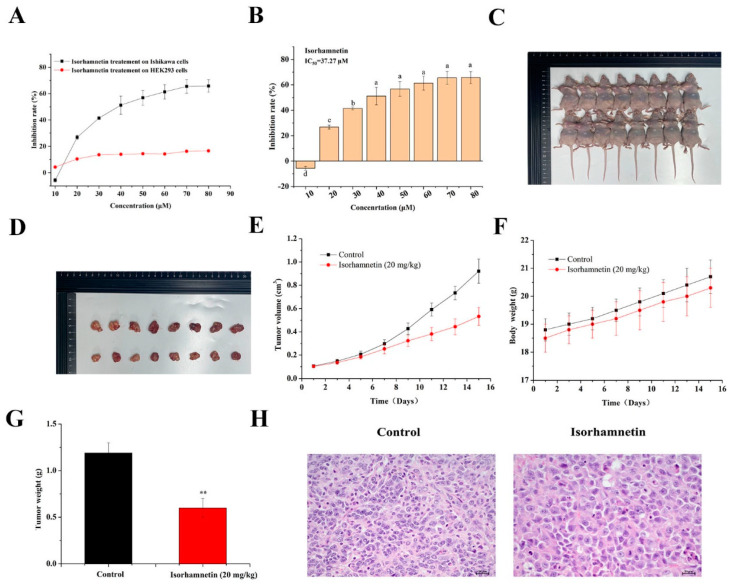
Figure 1.
Effect of isorhamnetin on the proliferation of Ishikawa cells and Ishikawa xenograft mice. (A): The 24 h inhibitory effect of isorhamnetin on Ishikawa cell and HEK 293 cell proliferation. (B): Bar chart of the inhibitory effect of isorhamnetin on proliferation. (C): Effect of isorhamnetin (20 mg/kg) on Ishikawa xenograft mice (n = 8). (D): Effect of isorhamnetin (20 mg/kg) on tumor size in Ishikawa xenograft mice (n = 8). (E): A line graph of the tumor volume in control and isorhamnetin–treated groups (20 mg/kg). (F): Line graph of the body weight of mice in the control and isorhamnetin groups (20 mg/kg). (G): Tumor volume of the control and isorhamnetin–treated groups (20 mg/kg). (H): H&E staining of tumors in the control and isorhamnetin–treated groups (20 mg/kg). The experiments were repeated at least three times in vitro, and nude mice experiments had at least eight mouse samples per group in vivo. Different alphabetic letters (including a, b, c, and d) denote significant differences between different groups (p < 0.05, n > 3). ** p < 0.01 included to show group differences in the in vivo experiment.

