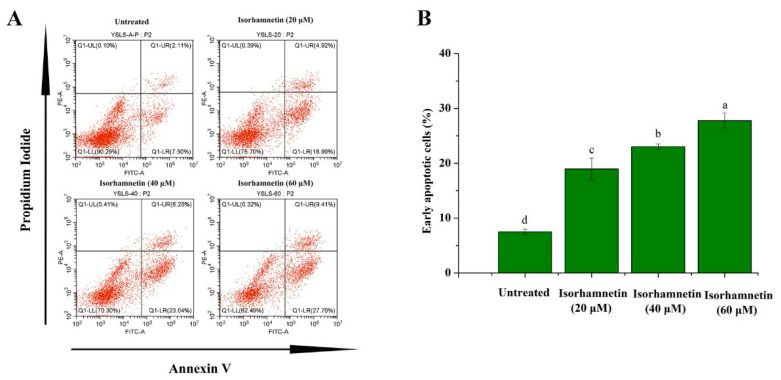
Figure 4.
Apoptosis of Ishikawa cells treated with isorhamnetin. (A): Flow diagram of the effect of different concentrations of isorhamnetin (0 μM, 20 μM, 40 μM, and 60 μM) on apoptosis. (B): Quantitative analysis of the effects of isorhamnetin on early apoptotic cells with different concentrations of isorhamnetin (0 μM, 20 μM, 40 μM, and 60 μM). Different alphabetic letters (a, b, c, d) denote significant differences between different groups (p < 0.05, n ≥ 3).

