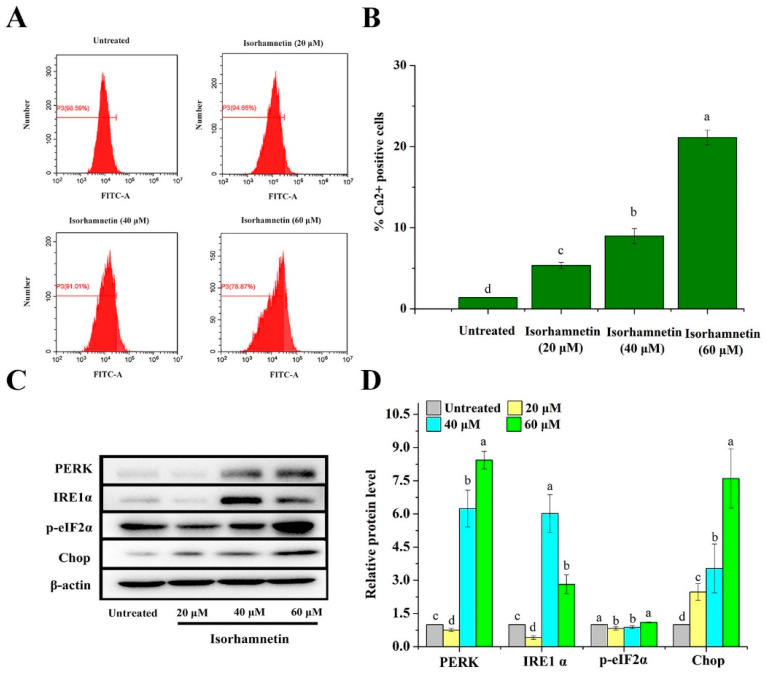
Figure 5.
Endoplasmic reticulum stress on Ishikawa cells treated with isorhamnetin. (A): Flow diagram of the effect of different concentrations of isorhamnetin (0 μM, 20 μM, 40 μM, and 60 μM) on calcium ion permeation. (B): Quantitative analysis of the effects of isorhamnetin (0 μM, 20 μM, 40 μM, and 60 μM) on calcium ion permeation. (C): Effect of isorhamnetin on PERK, IRE1α, p-eIF2α, and Chop under endoplasmic reticulum stress. (D): Quantitative protein map of the effect of isorhamnetin on PERK, IRE1α, p-eif2α, and Chop under endoplasmic reticulum stress. Different alphabetic letters (a, b, c, d) denote significant differences between different groups (p < 0.05, n ≥ 3).

