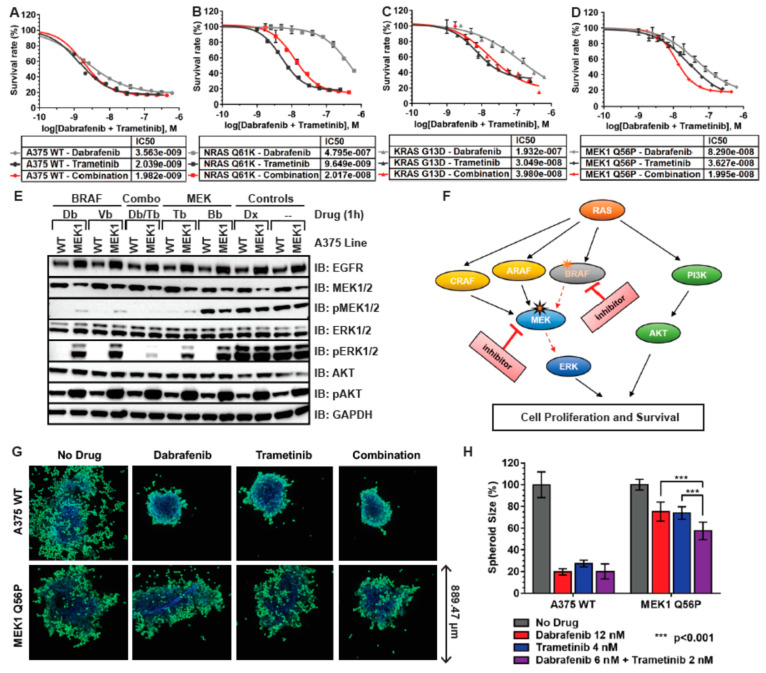
Figure 5.
MEK1 Q56P melanoma model is sensitive to combination BRAF/MEK inhibitor treatment in both 2D and 3D tissue culture. (A) Dose-response curves for A375 WT cells in 2D tissue culture with dabrafenib (grey line), trametinib (black line), or a combination of dabrafenib and trametinib (red line, molarity indicates total drug concentration); (B) Dose-response curves for NRAS Q61K cells in 2D tissue culture with dabrafenib, trametinib, or a combination of dabrafenib and trametinib; (C) Dose-response curves for MEK1 Q56P cells in 2D tissue culture with dabrafenib, trametinib, or combination; (D) Dose-response curves for MEK1 Q56P cells in 2D tissue culture with dabrafenib, trametinib, or combination. Lower survival with combination indicates synergistic drug killing in this line; (E) Immunoblot demonstrating synergistic inhibition of the MEK/ERK signaling pathway in MEK1 Q56P melanoma model cells in 2D tissue culture. Cells were treated with either 1.0 μM of the indicated inhibitor compound or with 0.5 μM each of each indicated drug for 90 min prior to harvesting protein (Db = dabrafenib 1.0 μM, Vb = vemurafenib 1.0 μM, Tb = trametinib 1.0 μM, Bb = binimetinib 1.0 μM, Db/Tb = dabrafenib 0.5 μM + trametinib 0.5 μM); (F) Model of synergistic inhibition of the RAS/RAF/MEK/ERK pathway by combination MEK and BRAF inhibitor treatment. Orange star indicates the primary BRAF V600E mutation which drives cell proliferation in the absence of BRAF inhibitor. Treatment with BRAF inhibitor results in secondary MEK1 Q65P mutation (black outlined orange star). In the presence of these two mutations, upstream pathway inhibition with BRAF inhibitor in combination with downstream pathway inhibition with MEK inhibitor (red arrows) leads to less cell survival and proliferation than is observed when each drug is used alone; (G) Susceptibility of MEK1 Q56P cells grown in 3D tissue culture to dabrafenib, trametinib, and combination drug treatment. For each indicated cell type, 500 cells were seeded in each well of a ULA spheroid microplate and grown for three days in the absence of drug. The spheroids were then treated with 12 nM dabrafenib, 4 nM trametinib, a combination of 6 nM dabrafenib and 2 nM trametinib, or vehicle control for an additional three days. Spheroids were then stained with 2 μM Calcein AM green and NucBlue live-cell nuclear marker for 90 min and then imaged; (H) Spheroid sizes were calculated relative to the un-drugged condition. Results from at least n = 3 spheroids for each condition were averaged and plotted, statistical analysis was performed using two-way ANOVA with multiple comparisons. ***, p < 0.001.

