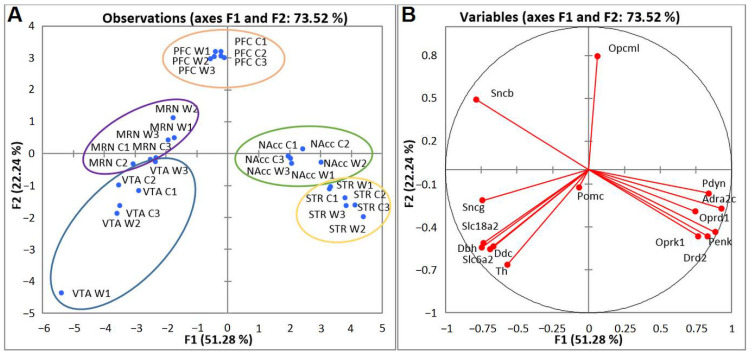
Figure 6.
PCA plots based on covariation of genes on the basis of expression profiles of 15 CAergic and opioidergic DEGs across 30 samples, which comprise RNA-Seq FPKM data for five brain regions. (A) Active observations. W1, W2, and W3: winners; C1, C2, and C3: controls; VTA: ventral tegmental area, NAcc: nucleus accumbens, MRN: midbrain raphe nuclei, STR: dorsal striatum, and PFC: prefrontal cortex. Ovals denote brain regions. (B) Active variables. The graph illustrates distinct clustering of DEGs.

