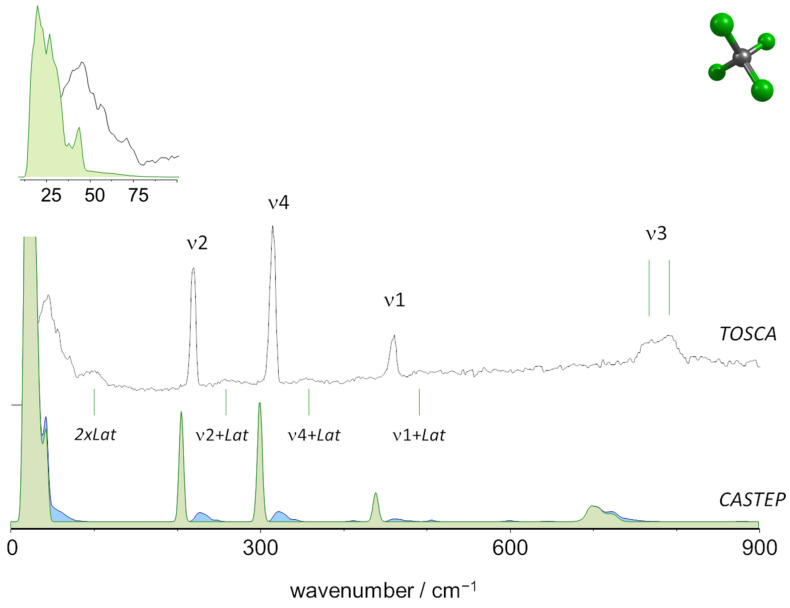
Figure 1.
The INS spectra of tetrachloromethane (carbon tetrachloride) up to 900 cm−1: Experimental (top, TOSCA) and simulated from periodic calculations (bottom, CASTEP). Colors indicate the intensity contributions from fundamental modes (green) and two-quanta events (blue). “Lat” stands for librational and translational lattice modes. Inset: detail of the low wavenumber region.

