Figure 3.
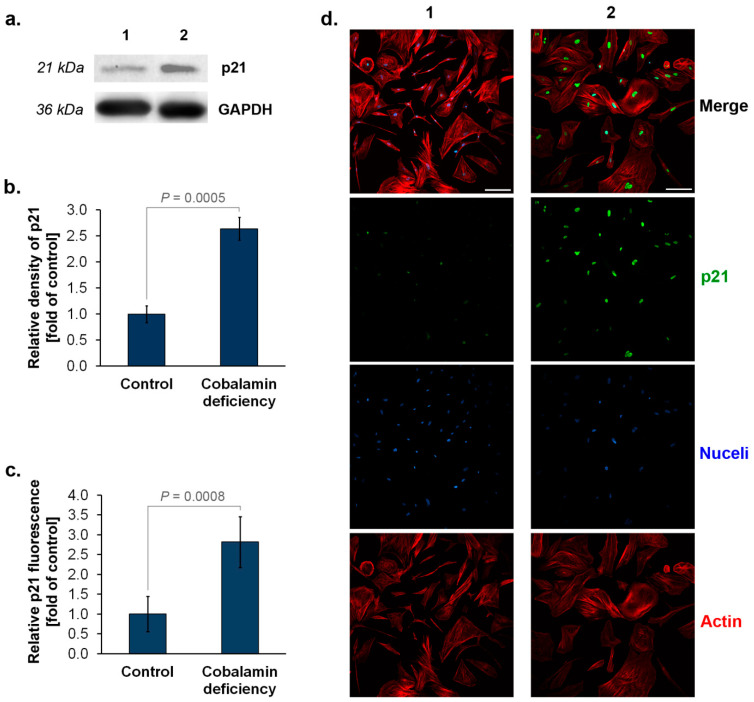
Elevated expression of p21 (p21Waf1/Cip1) in cobalamin deficient astrocytes. Representative blot (a) and quantification of Western blot bands by densitometry, where 1 = Control, 2 = Cobalamin deficiency (b). Data from fluorescence intensity measurements (c) and representative microphotographs of immunolabeled p21 protein (d). Bar graphs represent the mean ± SD of three independent experiments. p values from the unpaired t-test test are indicated. The scale bar shows 200 µm.

