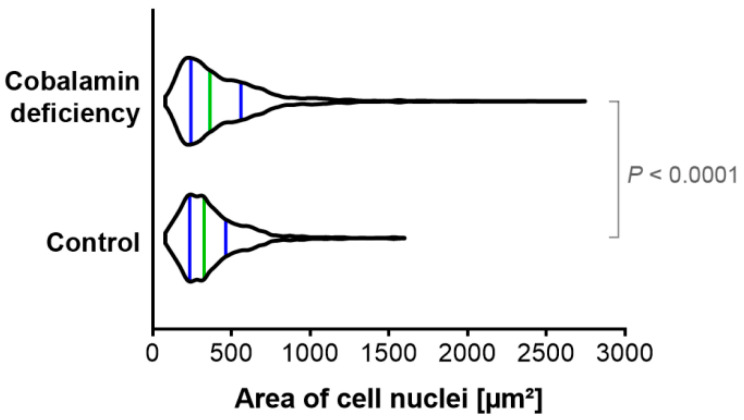
Figure 4.
Cobalamin deficiency in astrocytes affects cell nuclei area. The cell nuclei were stained with SYTO Deep Red Nucleic Acid Stain and then visualized using a confocal system. Image analysis included creating the binary layer through thresholding in the channel of SYTO Deep Red Stain in the Nikon NIS Elements AR software. Then, the regions of interest (ROIs) were created, and an automated measurements tool was used to determine the area of the individual cell nuclei within each of the analyzed microphotographs. The violin plot depicts data distribution with a green line indicating the median, and blue lines indicating the first and the third quartiles. p value from the Mann–Whitney U test is indicated.

