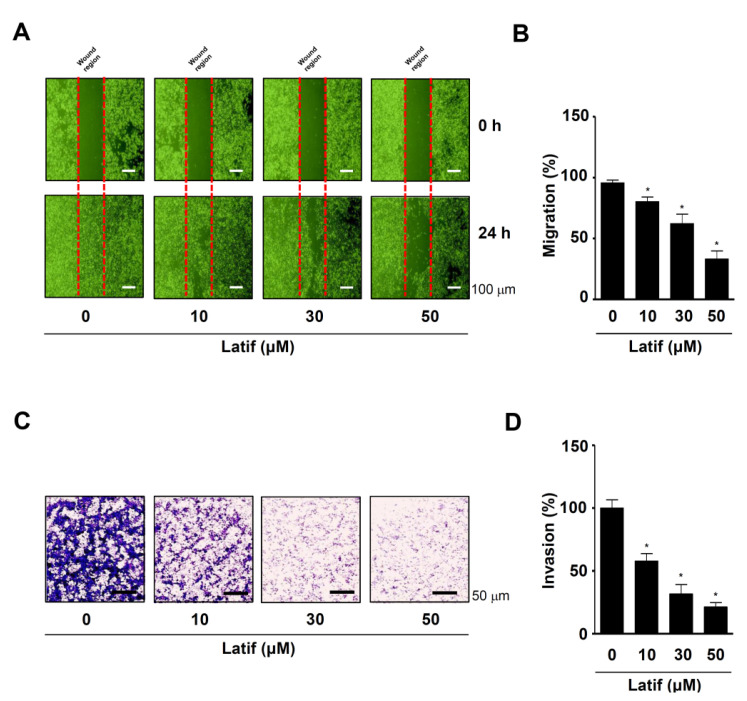
Figure 6.
Effects of Latif on cell migration and invasion in human YD-10B OSCCs. (A,B) Amounts of 10, 30, and 50 μM Latif were treated for 24 h in YD-10B OSCCs, and then cell migration was then analyzed using a wound-healing assay. At the indicated time points, the migration rates were monitored using a light microscope (A). The bar graph shows the relative value of migration (%) normalized to the control (B). (C,D) The invasion rates of Latif-treated cells (10, 30, and 50 μM) were analyzed using a Boyden chamber assay. Invasive cells were fixed, stained, and observed using a light microscope (C). The bar graph shows the relative value of invasion (%) normalized to the control (D). Data are represented as mean ± S.E.M. Significance was set at p < 0.05, which is indicated by an asterisk in the graph.

