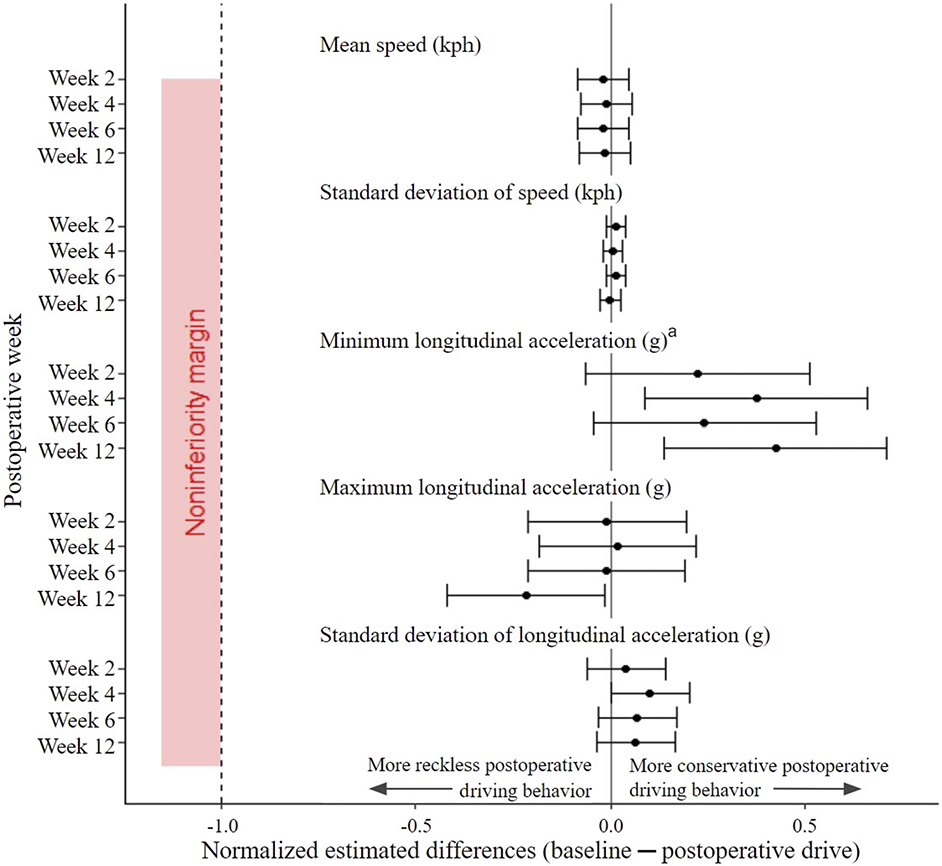
Fig. 4.
Estimated differences between baseline and postoperative speed and longitudinal kinematic metrics, with 95% CIs (indicated by the error bars normalized to the noninferiority limit for that metric). There was no difference in speed (kilometers per hour [kph]) and the standard deviation of the acceleration (gravitational force equivalent [g]) across all postoperative drives compared with baseline; the minimum longitudinal accelerations (g) at postoperative weeks 4 and 12 were more conservative and the maximum longitudinal acceleration (g) at postoperative week 12 was more reckless compared with baseline. The superscript a indicates that the inverse of the estimated differences and 95% CIs was taken to appropriately reflect the type of driving behavior; unlike for the other 4 metrics, an estimated difference of <0 for minimum longitudinal acceleration represents more conservative driving behavior.

