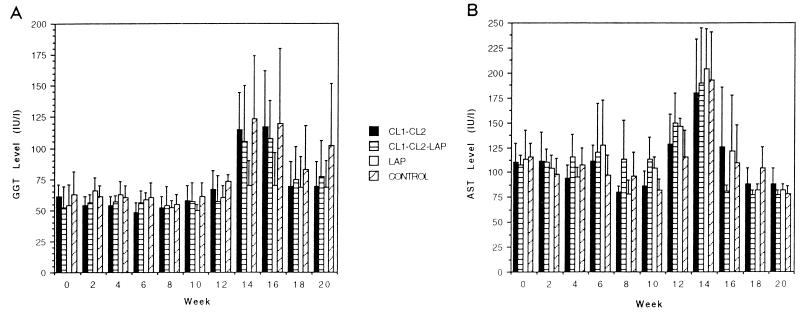
FIG. 5.
Kinetic analysis of GGT (A) and AST (B) levels in sera of sheep of trial 2. Sera were obtained every 2 weeks, until the end of the experiment, from all animals in group 1 (vaccinated with CL1 plus CL2), group 2 (vaccinated with CL1, CL2, and LAP), group 3 (vaccinated with LAP), and group 4 (PBS control). Bars represent the mean levels of enzymatic activity within each group ± the standard deviations.

