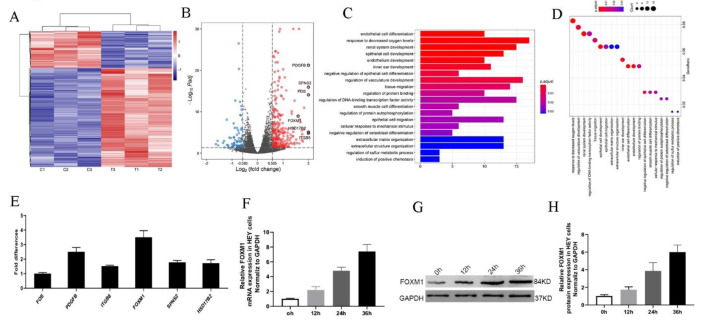
Figure 4.
Transcriptome analysis of HEY cells treated with HO-ADSC exosomes. (A). Heatmap showing differentially expressed genes in HO-ADSC exosome-treated HEY cells and HEY control cells. (B). Volcano map showing the upregulated and downregulated genes from HO-ADSC exosome-treated HEY cells and HEY control cells. (C,D). Bioinformatics analysis was performed to determine clusters of differentially expressed genes with enriched molecular functions. (E). qRT–PCR experiments were performed to detect the expression of the top 6 upregulated mRNAs. (F). FOXM1 mRNA expression was measured by qRTPCR after treatment with HO-ADSC exosomes for 0, 12, 24, and 36 h. (G). Western blotting was performed to evaluate FOXM1 expression after treatment with HO-ADSC exosomes for 0, 12, 24, and 36 h. (H). Quantitative analysis of FOXM1 protein levels in HEY cells.

